

Overview of Common Stains
Full overview of the most common stains, including how to identify them and treat them
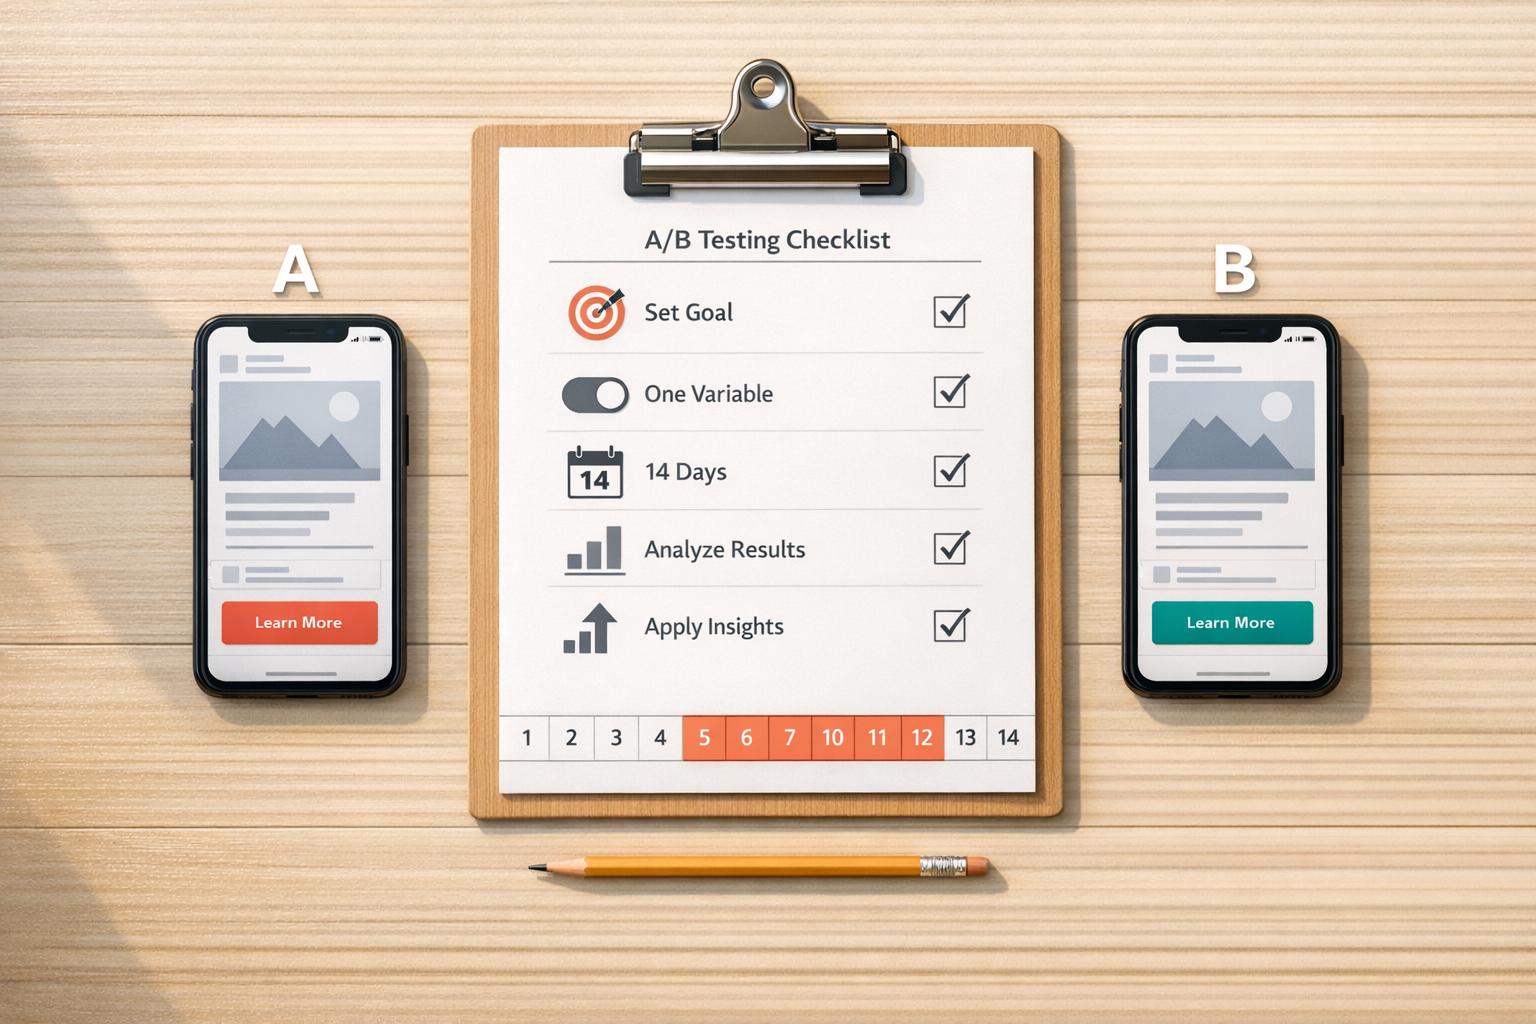
Running ads without testing is a waste of budget. A/B testing solves this by comparing two ad versions to see what works best. It’s simple: test one change at a time - like a headline, image, or call-to-action - and let data guide your decisions. For home service providers, this means better leads, lower costs, and smarter campaigns.
A/B testing isn’t a one-time task - it’s a process to refine ads and boost ROI over time. Stick to a structured approach, and you’ll see measurable improvements in your campaigns.

5-Step A/B Testing Process for Social Media Ads
When it comes to A/B testing, preparation is everything. Jumping into a test without a solid plan is like starting a home renovation without a blueprint - you’ll waste time and resources, and the results may not make any sense. Careful planning ensures your test produces clear, actionable insights instead of a mess of confusing data.
Start by defining a single, specific goal. Are you aiming for more website traffic? Higher quote requests? Lower cost per lead? Once you’ve nailed down your objective, pick a primary metric that directly reflects it.
For instance:
Secondary metrics, like cost per click (CPC) or engagement rate, can provide additional context but shouldn’t distract from your main focus.
| Goal Category | Primary KPI | Secondary Metrics |
|---|---|---|
| Brand Awareness | Impressions / Reach | Video Views, Follower Growth |
| Engagement | Engagement Rate | Likes, Comments, Shares |
| Website Traffic | Click-Through Rate | Cost Per Click (CPC), Link Clicks |
| Conversions | Conversion Rate | Cost Per Lead (CPL), CPA |
| Video Performance | Average Watch Time | Completion Rate, 3-Second Views |
Before diving in, establish a baseline. For example, if your current CTR is 1.2%, you’ll need this number to determine whether a post-test CTR of 1.5% reflects actual progress or just normal variation. Use this baseline, along with past performance data, to shape your hypothesis.
Take a close look at your historical data. What types of content have resonated most with your audience? For example, do your local homeowners engage more with before-and-after photos, or do they prefer behind-the-scenes videos of your team? Does mentioning pricing upfront drive clicks, or does focusing on the transformation work better?
Once you’ve reviewed the data, craft your hypothesis using an “if/then” format. For example: “If we use a question-based headline, then CTR will increase because homeowners respond well to direct questions about their needs.” This approach gives your test a clear direction and makes analyzing the results much easier.
In one LinkedIn experiment, senior marketing manager Cassandra Clark and her team hypothesized that using a speaker’s image in a webinar ad would outperform a company logo. The result? The speaker’s image drove a 326% lift in click-through rate.
Now it’s time to zero in on a single change. Testing multiple elements at once - like your headline and your image - will leave you guessing about what actually caused any changes in performance. Did the headline work? Was it the image? Or both? You’ll never know.
Instead, focus on testing one element at a time. Start with the aspect most likely to influence your goal. For many home service providers, the visuals (photo or video) are a great first step since they’re often the first thing people notice. If your engagement rates are already solid but conversions are lagging, consider testing your call-to-action (CTA) button text instead.
A great example comes from Kettle & Fire, a bone broth brand, which tested video lengths on Facebook to see which format drove more sales. The shorter video resulted in a 14-point increase in brand awareness and a 1.5 lift in purchasing consideration and sales conversions.
Now that you've done your research, it's time to put your A/B test into action. How you structure this step is critical - if it's not set up properly, the results won't be reliable. The idea here is straightforward: create two versions of your ad with only one difference between them, and ensure both versions are given an equal chance to reach your audience. This method allows you to gather clear, actionable insights that tie directly to your advertising goals.
Start by setting up Version A as your control ad - this could be your original ad or the one that’s currently performing the best. Then, create Version B as your variation, where you introduce the single change you identified in Step 1. For example, you might replace a static image with a video or test a new call-to-action, like swapping "Get Your Free Quote" for "Schedule Your Service Today." The key is to keep everything else exactly the same.
A small tweak like this can have a big impact. For instance, past tests have shown that just changing the headline can significantly boost click-through rates and conversions.
"If you vary the image and the headline, then you won't know which is responsible for the differences in your two ads' reception."
– Christina Newberry, Hootsuite
Most ad platforms make this process simple. On Meta Ads Manager, for instance, you can use the "Make a copy of this ad" feature to duplicate your control ad and then adjust the one element you want to test. This saves time and ensures consistency, so you don’t have to rebuild the entire ad from scratch.
Once your two versions are ready, the next step is to ensure both ads are shown to a fair and representative audience.
For accurate results, your audience needs to be divided randomly and evenly between the two ad versions. Avoid manually splitting your audience, as this can lead to overlapping groups and skew the results. Instead, rely on the platform’s built-in tools to automate this process.
Make sure your audiences are mutually exclusive, meaning no single person sees both versions of the ad. If someone encounters both, it muddies the data and makes it impossible to pinpoint which ad influenced their behavior.
"A big value of split testing is being able to prevent audience overlap so you know that the same audience is not seeing multiple variants which could affect the results."
– Nicole Ondracek, Paid Ads Specialist, HubSpot
Budget allocation is equally important. Split your budget evenly - 50/50 is the standard approach. For example, if your total budget is $100, allocate $50 to each version. To get meaningful data, aim for a total budget of at least $100 and ensure each ad version reaches a minimum of 1,000 impressions. Stick to the primary KPI you defined earlier to measure success effectively.
Once your audience is divided, simplify the test management process by leveraging platform-specific tools. Tools like Meta Ads Manager, LinkedIn Campaign Manager, or TikTok's Split Test feature can automate audience splitting and performance tracking.
These tools handle everything for you - splitting the audience, monitoring performance, and even calculating statistical significance. For example, Meta Ads Manager offers an A/B Test toolbar that allows you to create a test from scratch or compare two existing ads. The Experiments Tool in Meta Business Suite goes a step further, letting you manage all your tests - whether they’re scheduled, running, or completed. LinkedIn and TikTok offer similar tools tailored to their platforms and ad formats.
Using these built-in tools not only keeps your test clean but also eliminates the need for manual calculations or spreadsheets. Plus, they provide detailed reporting, showing you which version performed better and why - all in one place.
Once your test is live, it’s time to step back and watch. Think of it like a science experiment - any meddling during the process can skew the results and make your data unreliable. The objective is straightforward: let both ads run under the same conditions long enough to collect meaningful data. Only then can you confidently identify the winning strategy.
Patience is key here. A minimum of 7 days is recommended to account for natural fluctuations in user behavior. People browse differently on weekdays versus weekends, and a single day’s results won’t tell the full story. Meta suggests this 7-day minimum, noting that shorter tests often lead to inconclusive outcomes. For even more dependable results, aim for 14 days to capture a full business cycle and reduce the impact of anomalies. However, don’t stretch your test beyond 30 days, as audience fatigue or changes in market conditions can muddy the results.
"For the most reliable results, we recommend a minimum of 7-day tests."
– Meta
If your business involves longer decision-making processes - like high-ticket services such as HVAC installations or home remodels - consider extending your test to 10 or more days. This ensures you capture conversions accurately. And if the results remain unclear after a week, running the test for an additional 7 days may help reveal a trend. Remember, achieving statistical significance typically requires hundreds or even thousands of impressions per ad variation.
Timing is everything. Both ad variations need to launch simultaneously to ensure they’re tested under identical conditions. Running ads at different times - like Version A on Monday and Version B on Tuesday - introduces timing bias. This makes it hard to tell whether differences in performance are due to the ad itself or external factors like news events, weather, or day-of-the-week trends. Testing both ads at the same time eliminates this variable, ensuring they face the same platform algorithms and market environment.
To make this happen, synchronize the start and end dates in your ad platform’s scheduler. Many tools, like Meta Ads Manager or LinkedIn Campaign Manager, handle this automatically, but it’s worth double-checking before hitting "publish" to keep your data clean.
While your test runs, it’s fine to monitor metrics like click-through rates, conversions, and cost per result in real time. However, resist the urge to make changes. Adjusting budgets, tweaking targeting, or editing the creative - even slightly - can introduce new variables that compromise your data. The best approach is to commit to a "hands-off" period for the entire test duration, no matter how tempting early results might seem.
"Think of your A/B test as a controlled experiment - any interference compromises the results."
– Vertex Marketing Agency
Wait until your results reach statistical significance - often indicated by a p-value below 0.05 - before declaring a winner. If one ad suddenly stops serving impressions, investigate for technical issues instead of assuming it’s underperforming. Use custom tags or labels in your analytics dashboard to organize and compare metrics without altering the test itself.
When executed properly, A/B tests can lead to conversion rate improvements of up to 49%. With clean, reliable data in hand, you’ll be ready to dive into the analysis phase in the next step.
Your test is complete - now it’s time to figure out which ad came out on top. This isn’t about guessing or personal opinions; the data holds the answers. The goal is to identify meaningful performance differences, confirm they’re not due to chance, and capture insights for future campaigns. Here’s how to break it all down and turn results into actionable takeaways.
Start by focusing on the primary metric that aligns with your campaign objective. For instance, if your goal is to boost traffic, prioritize the click-through rate (CTR). If conversions are your focus, look at metrics like conversion rate or cost per acquisition (CPA).
Don’t stop there - secondary metrics provide context and explain why one version performed better. These might include cost per click (CPC), engagement rate (likes, comments, shares), video watch time, or even the thumb-stop ratio (how often users pause to engage with your ad).
| Campaign Goal | Primary Metric | Secondary Metrics for Context |
|---|---|---|
| Awareness | Reach, Impressions, CPM | Frequency, Brand Lift |
| Traffic | Click-Through Rate (CTR), Link Clicks | CPC, Landing Page Views |
| Engagement | Engagement Rate, Shares, Comments | Video Watch Time, Thumb-stop Rate |
| Conversions | Conversion Rate, Cost Per Acquisition (CPA) | ROAS, Lead Quality |
Before declaring a winner, confirm the results are statistically sound. Statistical significance ensures the performance difference isn’t just a fluke. A common benchmark is a p-value of 0.05 or lower, which means you can be 95% confident the results are valid.
Most ad platforms, like Facebook Ads Manager or LinkedIn Campaign Manager, have built-in tools to help with this. If you need additional help, third-party calculators from providers like HubSpot or Unbounce can also do the trick. Here’s a quick guide:
"Statistical significance is like a truth detector for your data. It helps you determine if the difference between any two options... is likely a real or random chance." – Shadrack Wanjohi, Writer, HubSpot
For example, imagine a SaaS company testing two Instagram call-to-action phrases: "Start Your Free Trial" versus "Get Started Today." Over 30 days, "Start Your Free Trial" drove a 28% increase in sign-ups. With a 95% confidence level, they rolled it out across campaigns, leading to a sustained 20% boost in conversion rates. This shows how data-backed decisions can lead to measurable success.
Once you’ve verified the metrics, make sure to document everything for future reference.
Whether the test produced a clear winner or not, record all the details. Use a spreadsheet or shared document to track:
Also, note what worked - was it a compelling headline, a specific CTA color, or a particular image style?
"A big value of split testing is being able to prevent audience overlap so you know that the same audience is not seeing multiple variants which could affect the results. That way, you can confidently say which one is the clear winner." – Nicole Ondracek, Paid Ads Specialist, HubSpot
These records are more than just notes - they’re the foundation for your next test. Over time, patterns will emerge, showing what clicks with your audience. Share these insights with your team, and use the winning ad as your new control (Version A) for the next round of testing. This process ensures your campaigns keep getting better, one test at a time.
Now that you've pinpointed your winning ad during the analysis phase, it's time to put those insights into action. The true payoff of A/B testing lies in applying what you've learned and building on that foundation. Start by replacing underperforming ads with your winning version. To boost its reach without disrupting the algorithm, gradually increase the budget by 10–20%. This ad now becomes your new control (Version A) for future tests, ensuring each experiment builds on prior success rather than starting from scratch.
Take the elements that worked - whether it’s the headline, visuals, or call-to-action - and apply them across other campaigns and platforms. For instance, if a video ad thrives on Facebook, try it on Instagram Reels or TikTok. Also, ensure your landing page aligns with the ad’s messaging and visuals. A seamless experience from the ad to the landing page can significantly improve conversions. Jovita Grigaliūnaitė, Paid Marketing Lead at Billo, explains:
"Ad budgets are too valuable to gamble on hunches. Systematic ad testing ensures your creative decisions compound into lower CPA and higher ROAS over time".
Here’s how to integrate these insights effectively into your campaigns.
Once you've confirmed the winning ad’s statistical significance, roll it out across your campaigns. Replace underperforming ads and keep a close eye on performance during the initial days to ensure the results hold steady as you scale. As mentioned earlier, this winning ad becomes your new control for subsequent tests.
You can also experiment with the winning creative in new audience segments or placements. For example, if it worked well as a Feed ad, test it in Stories or Reels to uncover additional ROI opportunities. Keep in mind that even successful ads can experience ad fatigue over time. Watch metrics like engagement rates and CPA, and refresh the creative before performance begins to decline.
A/B testing is an ongoing process. The most effective campaigns are built through sequential testing, where each winning version becomes the baseline for the next experiment. For example, if Headline B outperformed Headline A, test Headline B against Headline C. If a video ad surpassed a static image, try testing different video lengths or hooks.
To stay organized, focus on one variable per test cycle. For instance, dedicate January to testing visuals, February to headlines, March to CTAs, and April to audience targeting. This method keeps your efforts streamlined and avoids overlapping tests. Make sure to document everything - save screenshots of winning ads, note which demographics responded best, and track external factors like holidays or website issues. Over time, you’ll develop a custom playbook of strategies tailored to your brand, reinforcing the step-by-step process established in earlier steps.
With your testing roadmap in place, you’re ready to scale your efforts with expert support.
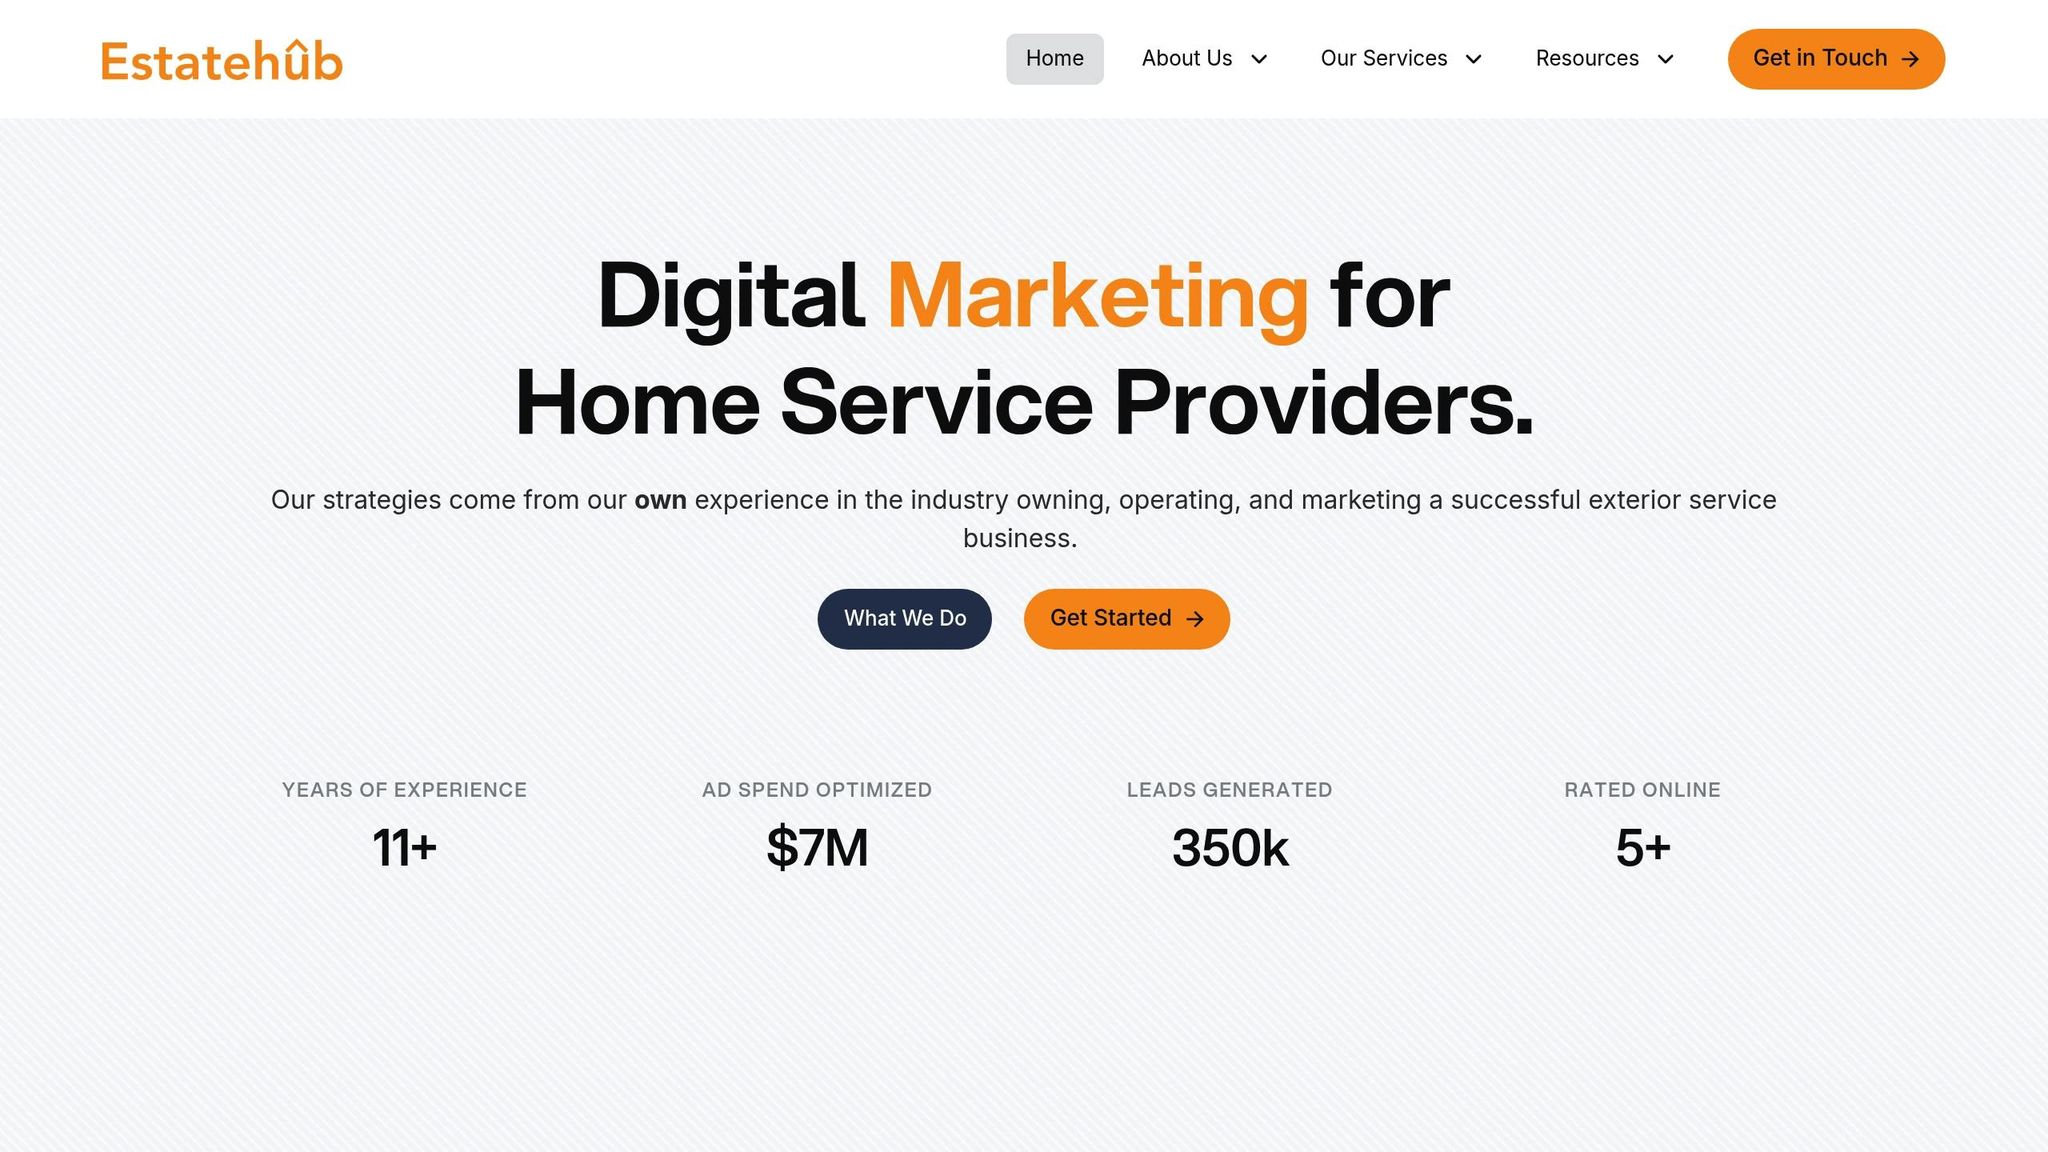
A/B testing takes time and expertise, which can be challenging for home service providers who are already busy managing customer calls, scheduling, and day-to-day operations. That’s where Estatehub steps in. Their team specializes in paid ad optimization and lead generation specifically for home service businesses, handling everything from test setup to performance analysis.
Estatehub focuses on revenue-driven campaigns, tailoring their strategies to scale your business effectively. They use tools like HighLevel CRM to track leads from the initial click to closing, ensuring every ad dollar contributes to measurable growth. Whether it’s testing creatives, refining audience targeting, or expanding to new platforms, Estatehub’s expertise helps you avoid costly mistakes and maximize ROI. Visit https://estatehub.io to explore their Growth and Premium plans and see how they can elevate your social media advertising.
A/B testing isn’t something you do once and forget about - it’s an ongoing process that turns guesswork into actionable insights. By sticking to a structured approach, you can swap out assumptions for real data, ensuring every advertising dollar delivers more for your home service business. In fact, companies that regularly run A/B tests on their ads report a 20% higher return on ad spend, and businesses using this method for Facebook ads have achieved conversion rate increases of up to 25%.
As Ritika Tiwari, Content Strategist at Socialinsider, explains:
"A/B testing is your shortcut to data-driven decisions. It's like having a cheat code to learn what your audience actually loves so you can stop relying on hunches and start scaling what works".
To get started, focus on setting clear objectives, testing one variable at a time, and running your experiments for 7 to 14 days to gather meaningful results. Keep an eye on metrics like click-through rates, cost per lead, and conversion rates, and document your findings. Over time, this creates a resource of proven strategies that can guide your future campaigns.
When you’re ready to take things further, Estatehub can simplify the process. With their expertise in paid ad optimization and tools like HighLevel CRM integration, they help you avoid expensive missteps and get the most out of your ad budget. Check out their Growth and Premium plans at https://estatehub.io to see how they can help your business grow.
The budget for an A/B test can be surprisingly affordable, starting at just a few dollars per variation. The exact amount depends on your overall ad spend, but even with a modest budget, you can gain meaningful insights. By concentrating on testing crucial ad components - like headlines, images, or calls-to-action - you can make data-driven improvements without breaking the bank.
If your A/B test doesn’t achieve statistical significance, it might just be a fluke. To tackle this, you can try a few things: increase your sample size, run the test for a longer period, or ensure your audience is big enough to spot real differences. These adjustments can make your test results more dependable.
When your leads take weeks to convert, it’s essential to adjust your A/B testing strategy to focus on long-term metrics. Start by aligning your testing period with your sales cycle to capture the full picture. Run ad variations at the same time to ensure fair comparisons, and leverage tracking tools to monitor delayed actions like sales or form submissions.
Patience is key here - wait until you achieve statistical significance across the entire conversion window. This approach helps you avoid being misled by short-term fluctuations and ensures your results truly reflect performance over time.
Sign up for the newsletter and be the first to read our articles.


Every single person on our agency team has spent a lot of time in the field either running their own business or working for larger marketing agencies. We have all put in the time responding to leads, helping customers, scheduling and doing services. This gives us a massive advantage when making decisions.
One thing that has always been very special to us, is the fact that (excluding spam / people that never used our services) we do not have any bad reviews. This absolutely does not mean we have never had unhappy clients, but if it happens, we make it right, and stand behind our promises.
We have seen, time and time again, other agencies using strategies and structuring campaigns the way that they are technically supposed to. Most of these "best practices" that are taught in our industry, simply do not transfer into local lead gen. This is partially because we do have a much different target audience, and are typically spending less, however optimizing for website traffic does not work here.
We have been there, jumping into starting a home service business, struggling, and doing everything wrong. It's humbling. Our team has all felt the highs and lows, which is why we get so excited for our clients to win, we know how good it feels.

Estatehub is not a normal agency, we know "clicks" don't get you sales. Let us show you how lead gen experts do it.

