


Overview of Common Stains
Full overview of the most common stains, including how to identify them and treat them
Core Web Vitals measure how well your website performs for users. These metrics - Largest Contentful Paint (LCP), Cumulative Layout Shift (CLS), and Interaction to Next Paint (INP) - impact both search rankings and user behavior. Faster websites with stable layouts and responsive interactions not only rank higher on Google but also drive more conversions. For businesses in competitive industries, like home services, improving these metrics can directly increase revenue. You can also book a call with our team to discuss a custom performance strategy.
Key takeaways:
Tools like PageSpeed Insights and Unlighthouse help analyze and improve these metrics:
Improving Core Web Vitals can reduce bounce rates, improve user satisfaction, and give you an edge over competitors in local markets.
Estatehub stands out for its website performance, particularly in how it addresses Core Web Vitals. These metrics are crucial for boosting lead generation and user engagement, which are key for home service providers like contractors, plumbers, and HVAC companies. By focusing on these areas, Estatehub offers insights that can directly benefit businesses in these industries. Let’s take a closer look at how Estatehub optimizes its performance.
LCP measures how fast the main content of a page loads, with the goal being under 2.5 seconds. A delay of just 1 second can lead to a 7% drop in conversions. Estatehub tackles this issue by using WebP image formats and assigning the fetchpriority="high" attribute to hero images. These optimizations shave off 200–400 milliseconds from LCP times, ensuring faster load speeds.
Visual stability is another key factor, especially on pages with forms and call-to-action buttons. Estatehub keeps its CLS score below 0.1 by defining explicit width and height attributes for images and reserving space for dynamic elements like testimonials or service cards. This prevents unexpected layout shifts that could lead to user errors, such as misclicks.
INP measures how quickly a site reacts to user inputs, such as clicking a button or submitting a form. Estatehub keeps its INP under the 200ms benchmark by limiting JavaScript tasks to under 50ms and breaking up longer scripts into smaller chunks. This ensures smooth interactions, particularly for mobile users who expect instant responses.
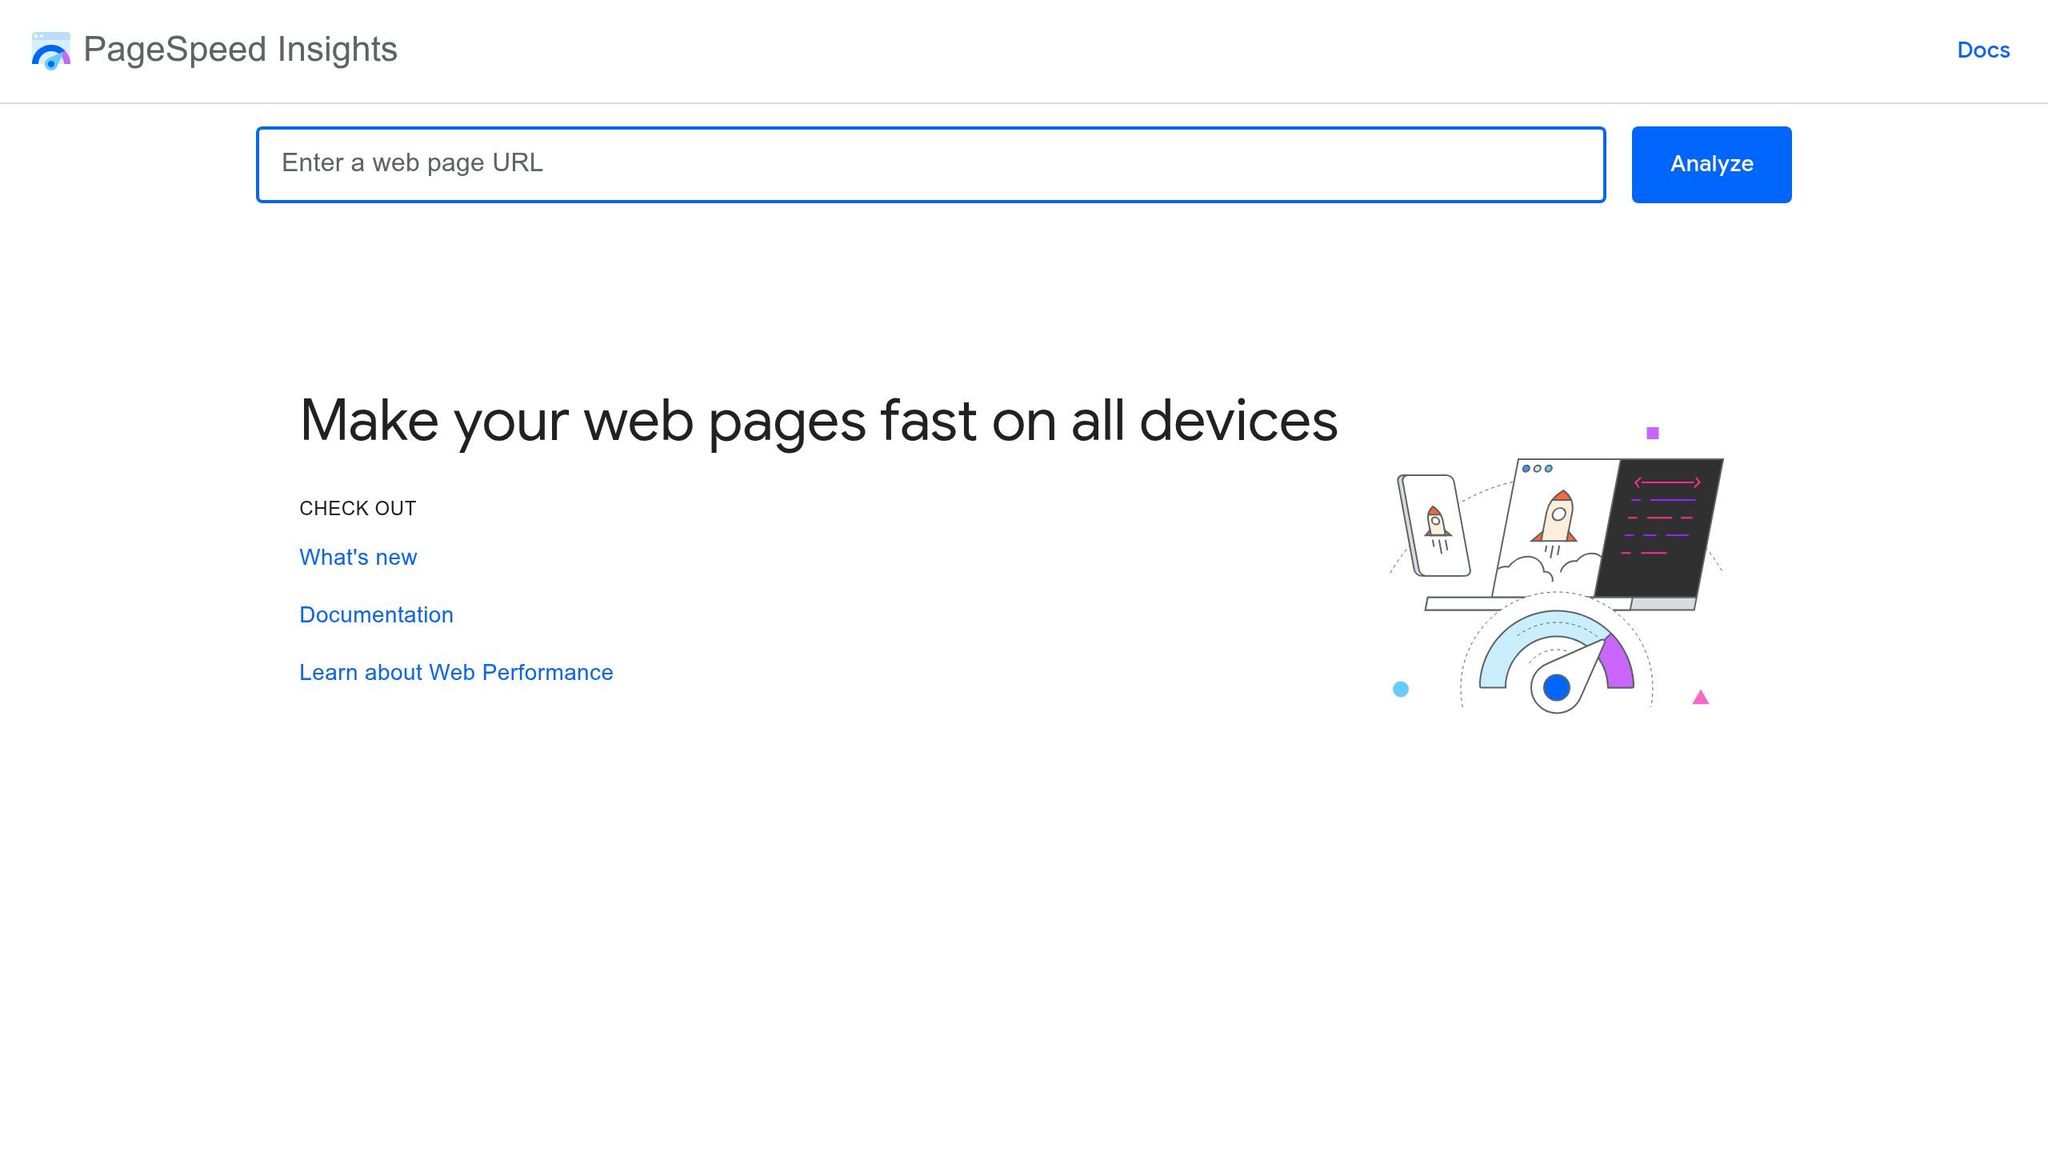
PageSpeed Insights, a free tool from Google, is a valuable resource for analyzing Core Web Vitals on any public URL. By entering a competitor's URL, you can access a detailed report on its performance metrics. The tool provides two types of data: Field Data, which reflects real-world user experiences collected over a 28-day period via the Chrome User Experience Report, and Lab Data, which comes from controlled simulations using the Lighthouse engine.
PageSpeed Insights breaks LCP into four distinct phases: Time to First Byte (TTFB), Resource Load Delay, Resource Load Time, and Render Delay. This detailed breakdown helps identify where delays originate. The tool also pinpoints the specific element causing LCP issues. Interestingly, about 72% of pages have an <img> element as the trigger, while text blocks account for roughly 18%. A great example of its impact: Vodafone managed to reduce their LCP by 31%, which led to an 8% boost in overall sales.
The tool's Diagnostics and Opportunities sections highlight elements causing layout instability, such as images without defined dimensions or CSS that loads late. For instance, Swappie, a retailer specializing in refurbished phones, improved their CLS score by 91%, which resulted in a 42% increase in mobile revenue. Google Search Central recommends:
To provide a good user experience, strive to have a CLS score of less than 0.1.
Replacing First Input Delay in March 2024, INP measures how quickly a site responds to all user interactions during a session. PageSpeed Insights identifies problematic scripts or tasks that block the main thread, helping uncover the sources of delays. To meet the Core Web Vitals standard, at least 75% of page views must achieve an INP of 200 milliseconds or less. The Rankture Blog explains:
A page might load fast (good LCP) but feel sluggish when you try to interact with it. INP captures that 'the page isn't responding' frustration that makes users bounce.
Next, we’ll see how Unlighthouse tackles these metrics.

Unlighthouse uses Google's Lighthouse engine to scan your entire website, running bulk tests across hundreds of pages. This approach helps uncover Core Web Vitals issues on deeper pages - like product listings or blog posts - that single-page audits often overlook. By combining these bulk scans with single-page analyses, you get a more complete view of your site's performance and how it stacks up against competitors.
The tool generates reproducible lab data by simulating controlled conditions, such as throttling. While this data differs from the real-world field data Google uses for rankings, it’s incredibly useful for debugging and tracking progress. To start a bulk audit, use the following command:
npx unlighthouse --site [url]
This will give you a detailed performance overview of all your site templates. Let’s break down how Unlighthouse evaluates key metrics like LCP, CLS, and INP to deliver these insights.
Unlighthouse goes beyond single-page tools by identifying LCP issues across your entire site. It measures how long the largest visible element - like an image or text block - takes to render on all page types. Harlan Wilton explains:
"The LCP element is the largest image or text block visible in the viewport: Images... account for 73% of mobile pages".
Only 59% of mobile pages achieve a "good" LCP score, making it a challenging metric to optimize. If Unlighthouse flags an image as the culprit, you can improve performance by converting it to WebP or AVIF formats and adding fetchpriority="high" to minimize lazy-loading delays. Additionally, poor LCP scores are often linked to an average Time to First Byte of 2,270 ms, suggesting that server response times play a significant role.
Unlighthouse’s site-wide scans reveal layout stability issues across various pages, from product listings to checkout flows and blog posts. Its CLS Debugger identifies which DOM elements cause layout shifts during the page load process. While 79% of mobile sites meet the CLS threshold of 0.1, the remaining 21% often face problems like images without set dimensions or web fonts that load late.
Since INP relies on real user interactions that can’t be simulated in a lab, Unlighthouse uses Total Blocking Time (TBT) as a proxy metric. TBT accounts for 30% of the overall Performance score. The INP Analyzer highlights slow JavaScript event handlers that exceed the 50 ms "long task" threshold, with TBT data pinpointing key delays. While 97% of desktop pages pass INP, only 74% of mobile pages achieve a "good" rating of 200 ms or less. This 23-point gap underscores the importance of mobile testing. Running site-wide audits helps you identify interaction-heavy pages and ensure your optimizations work across the board.
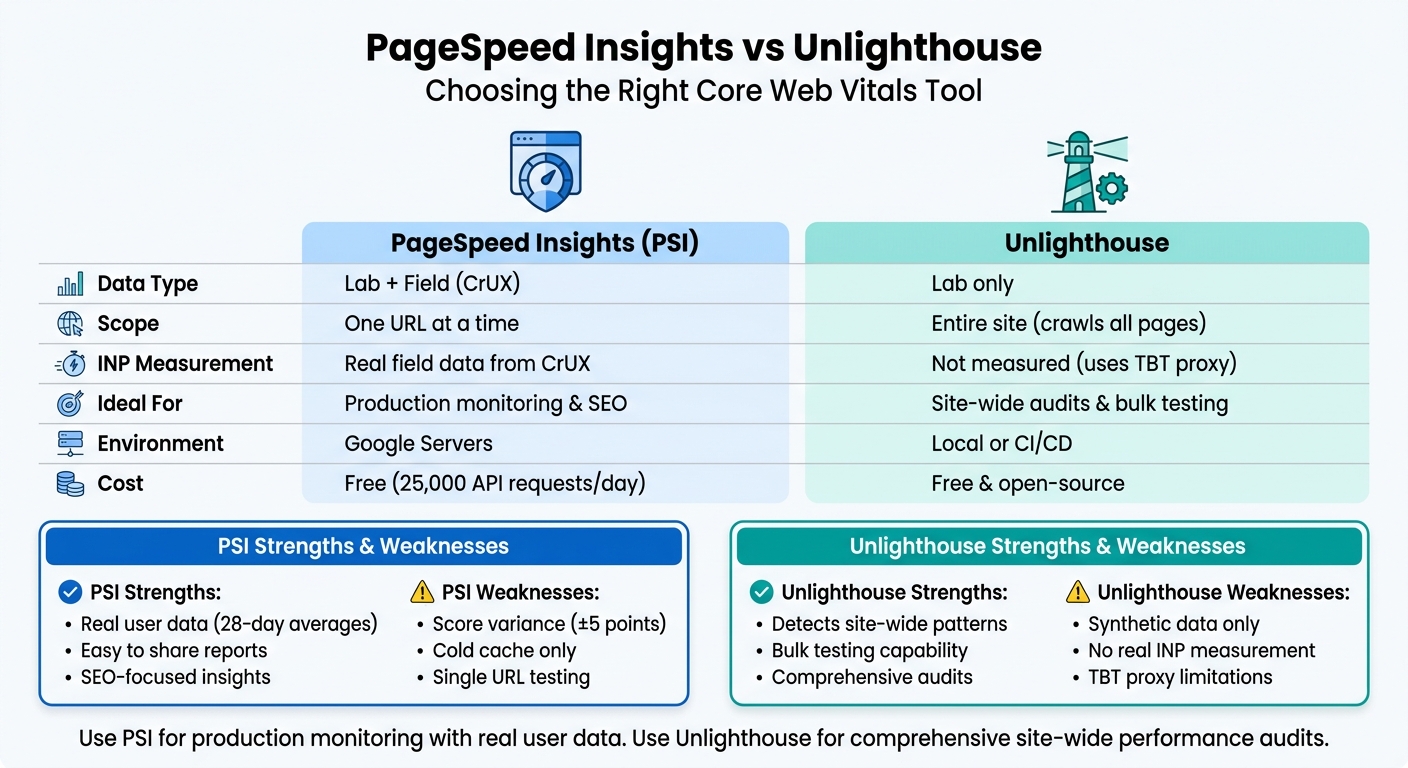
PageSpeed Insights vs Unlighthouse: Core Web Vitals Tool Comparison
Let’s break down the strengths and limitations of each tool to give you a clearer picture of their capabilities when measuring Core Web Vitals.
PageSpeed Insights (PSI) combines lab data with real-world field data from the Chrome User Experience Report (CrUX), making it a powerful tool for understanding both user experience and SEO impact. The field data represents 28-day averages based on actual user interactions. PSI is completely free and even includes an API that allows up to 25,000 requests per day. However, it does have its drawbacks. For instance, PSI only tests one URL at a time and always uses a cold cache, which might not accurately reflect the experience of returning visitors. Additionally, its scores can vary - expect fluctuations of around ±5 points due to shared server infrastructure. To address this, it’s recommended to run 3–5 tests and use the median result.
Unlighthouse, on the other hand, is ideal for site-wide performance monitoring. It crawls your entire site and runs Lighthouse audits on all discovered pages, which can help identify patterns - like layout issues causing cumulative layout shift (CLS) across multiple pages - that single-page tools might miss. It’s free and open-source. However, it only uses lab data and relies on Total Blocking Time (TBT) as a proxy for Interaction to Next Paint (INP). As Harlan Wilton explains:
Lighthouse cannot measure INP. It uses Total Blocking Time (TBT) as a lab proxy, but TBT only measures main‑thread blockage during initial load.
This means a page could show 0 ms TBT in the lab but still fail INP in the field if JavaScript delays interactions after the page loads.
Here’s a side-by-side comparison of the two tools:
| Feature | PageSpeed Insights (PSI) | Unlighthouse |
|---|---|---|
| Data Type | Lab + Field (CrUX) | Lab only |
| Scope | One URL at a time | Entire site (crawls all pages) |
| INP Measurement | Real field data from CrUX | Not measured (uses TBT proxy) |
| Ideal For | Production monitoring & SEO | Site-wide audits & bulk testing |
| Environment | Google Servers | Local or CI/CD |
| Strengths | Real user data; easy to share | Detects site-wide patterns |
| Weaknesses | Score variance; cold cache only | Synthetic data only |
For production monitoring and stakeholder reporting, PSI is the go-to choice because of its reliable field data. On the other hand, Unlighthouse is better suited for comprehensive, site-wide audits that can uncover performance issues across multiple pages. Keep in mind that PSI’s field data requires around 1,000 page loads within 28 days to generate, so low-traffic pages may only display lab data. Also, a score gap of 10–15 points between local Lighthouse and PSI is normal due to differences in hardware and network conditions.
This detailed comparison should help you choose the tool that aligns best with your performance monitoring goals and the specific needs of your website.
Comparing Core Web Vitals (CWV) across competitors highlights clear areas for improvement. Websites that meet all three CWV thresholds see an average of 24% higher rankings. However, only 42% of websites currently achieve this on mobile devices. This gap offers a prime opportunity to gain a competitive edge by addressing the basics.
Start by focusing on high-traffic, revenue-driving pages - such as service booking or contact form pages identified through Google Search Console - rather than attempting to optimize every page. As 137Foundry notes:
"Core Web Vitals are one of the few ranking factors entirely within your control. Unlike backlink acquisition or content authority building, performance optimization is a technical challenge with deterministic solutions."
– 137Foundry
Some practical improvements include preloading hero images to enhance Largest Contentful Paint (LCP), defining image dimensions to reduce Cumulative Layout Shift (CLS), and breaking JavaScript tasks into smaller chunks to improve Interaction to Next Paint (INP). For instance, in December 2025, Link-Assistant.com reduced Time to First Byte (TTFB) by 80% in Europe using geo-specific servers. When their "green" URLs turned "amber" in May 2022, they experienced a 30% drop in organic clicks, which rebounded after restoring their metrics.
Home service providers can benefit from Estatehub’s specialized website development and SEO services. By combining technical performance optimization with strategies focused on revenue, Estatehub ensures that faster-loading pages lead directly to increased conversions.
If you're looking to evaluate Core Web Vitals metrics using real user data, tools based on the Chrome User Experience Report (CrUX) are a great option. Platforms like RUMvision, Web Vitals Compare, and DebugBear make it easier to benchmark key metrics such as Largest Contentful Paint (LCP), First Input Delay (FID), and Cumulative Layout Shift (CLS) across multiple domains.
These tools often include features like visual scorecards and detailed insights, helping you pinpoint performance gaps and focus on improving your site’s performance.
PageSpeed Insights scores often fluctuate because of several variables. These include differences between lab and field data, the location where the test is conducted, the hardware being used, or the specific configurations of the testing tool. On top of that, tools may rely on varying versions or settings, which can also impact the results you see.
To get the most out of optimizing Core Web Vitals, start with your key pages rather than tackling your entire site at once. Prioritize pages that drive the most traffic or conversions - these will have the biggest impact on both user experience and search rankings. Once you've fine-tuned these critical pages to meet the necessary thresholds, you can gradually roll out improvements to the rest of your site. This step-by-step approach ensures you're using resources effectively while tracking measurable progress.
Sign up for the newsletter and be the first to read our articles.


Every single person on our agency team has spent a lot of time in the field either running their own business or working for larger marketing agencies. We have all put in the time responding to leads, helping customers, scheduling and doing services. This gives us a massive advantage when making decisions.
One thing that has always been very special to us, is the fact that (excluding spam / people that never used our services) we do not have any bad reviews. This absolutely does not mean we have never had unhappy clients, but if it happens, we make it right, and stand behind our promises.
We have seen, time and time again, other agencies using strategies and structuring campaigns the way that they are technically supposed to. Most of these "best practices" that are taught in our industry, simply do not transfer into local lead gen. This is partially because we do have a much different target audience, and are typically spending less, however optimizing for website traffic does not work here.
We have been there, jumping into starting a home service business, struggling, and doing everything wrong. It's humbling. Our team has all felt the highs and lows, which is why we get so excited for our clients to win, we know how good it feels.

Estatehub is not a normal agency, we know "clicks" don't get you sales. Let us show you how lead gen experts do it.

