

Overview of Common Stains
Full overview of the most common stains, including how to identify them and treat them
Your landing page can make or break your business. If visitors don’t convert, you’re losing potential revenue - often over $1,000 per job. Tracking key metrics like conversion rate, bounce rate, and page load time helps you identify what’s working and what’s not.
Here’s the bottom line:
By monitoring metrics like cost per lead (CPL) and traffic sources, you can focus your budget on what drives results. Simple changes - like clearer CTAs, faster load times, and short forms - can boost leads and revenue.
Start tracking these numbers now to make smarter decisions and grow your business.

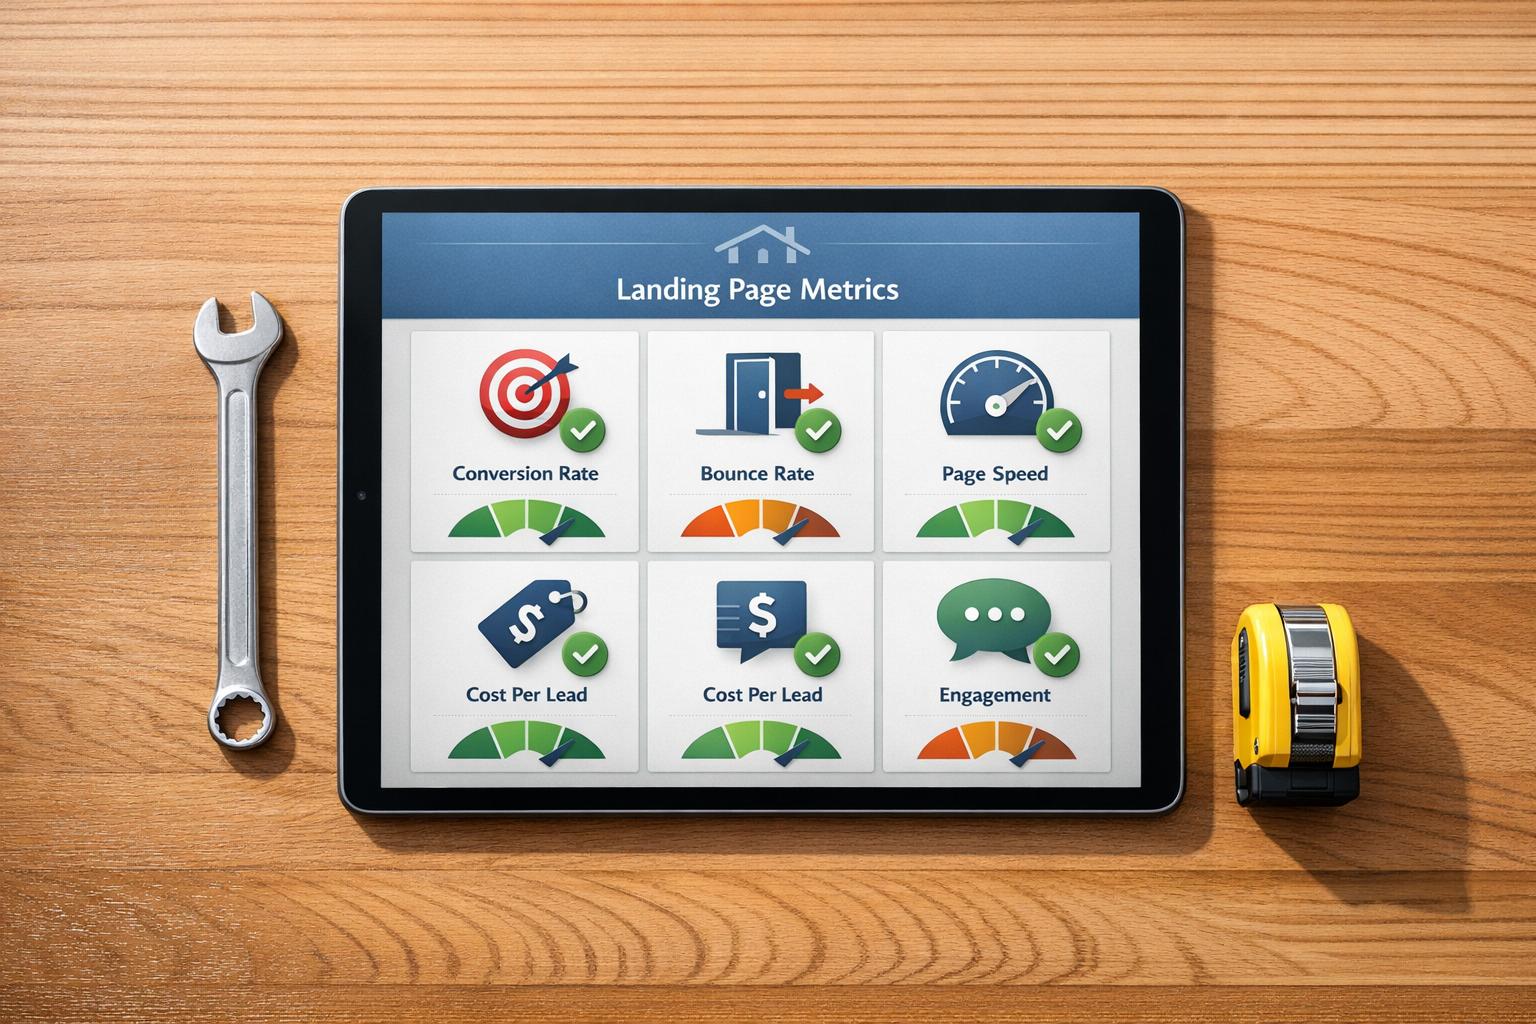
Landing Page Metrics Benchmarks for Home Service Providers
Every visitor matters, and the right metrics can show you where your landing page shines - or where it needs work. These metrics are essential for evaluating your landing page's performance.
Your conversion rate measures the percentage of visitors who complete a desired action, like calling your business, filling out a form, or booking a service. The formula is simple: (Total Conversions ÷ Total Visitors) x 100. For local businesses, a 3% conversion rate is a solid goal, while top performers hit 8–10%. For comparison, Google Ads average around 4.45%, and Facebook Ads perform slightly better at 7.44%.
Here’s an example: In September 2024, a sunroom building service revamped its landing page by adding a clear headline, a visible phone number, and a "Request Brochure and Pricing" call-to-action. They also showcased project photos and customer testimonials. These changes cut their cost per conversion from $500 to under $100. As Austin LeClear, Founder of Grow My Ads, puts it:
"Conversion rate optimization (CRO) is not just about making changes to your landing page; it's about making informed adjustments that drive better results, more customers, and higher profitability."
To improve your conversion rate, keep your forms short - stick to essentials like name, email, and phone number. Make your phone number clickable for mobile users, and track actions like button clicks and form submissions using tools like Google Analytics (GA4). Always send ad traffic to a dedicated landing page to minimize distractions and keep visitors focused on your call to action.
Now let’s look at how bounce rate impacts your page’s performance.
Your bounce rate shows the percentage of visitors who leave your page without taking any action. If a campaign-specific landing page has a 97% bounce rate, it means only 3% of visitors are converting. High bounce rates often point to issues like a mismatch between ad promises and page content, technical glitches, or poor mobile usability. For service-focused landing pages, aim for a bounce rate between 10% and 30%.
"A high bounce rate on your landing page often signals a mismatch between user expectations and what they actually see." – Kinga Edwards & Magdalena Dejnak, Content Writers, Landingi
To tackle bounce rates, make sure your landing page delivers on what your ad promises. For instance, if your ad highlights "Same-Day HVAC Repair", your page headline should reflect that exact offer. Place your main offer and call-to-action above the fold so visitors see it immediately. Avoid intrusive pop-ups and ensure your layout is optimized for mobile users.
Since page speed plays a big role in retaining visitors, let’s dive into how load time affects performance.
When it comes to landing pages, every second counts. A page that takes more than 3 seconds to load risks losing visitors before they even see your offer. In fact, a page that loads in 1 second can convert three times more visitors than one that takes 5 seconds. Each additional second of delay can drop conversion rates by up to 7%, with mobile users being even more sensitive to slow load times. Considering that 53% of mobile users abandon pages that take over 3 seconds to load - and with 83% of landing page traffic coming from mobile - speed is non-negotiable.
Your goal? A total load time between 1.5 and 2.5 seconds. Use tools like Google PageSpeed Insights to measure performance on both mobile and desktop. To speed things up, compress images to 70–100 KB, use modern formats like WebP, and implement lazy loading so images load only as users scroll. Remove unnecessary third-party scripts, and use a Content Delivery Network (CDN) to serve your page from servers closer to your visitors. Finally, make it a rule: no landing page should go live if it takes longer than 2 seconds to load on a 4G connection.
Core metrics provide a snapshot of performance, but user engagement metrics dig deeper, showing how visitors truly interact with your page. By combining these insights with core metrics, you can better understand user behavior and make data-driven improvements. These metrics go beyond simple traffic counts, offering a clearer view of engagement patterns.
The click-through rate (CTR) for your calls-to-action (CTAs) measures the percentage of visitors who click on buttons like "Request a Quote" or "Book Now". On average, landing pages see a CTR of about 3.5%, though some high-performing pages in the home services sector achieve even better results.
To improve your CTR, focus on clear, action-oriented phrases. For instance, using first-person language in CTAs - like "Get My Free Template" instead of "Get Your Free Template" - has been shown to increase clicks by up to 90%.
A real-world example comes from August 2025, when Fox Pest Control tested a "Text With Us" widget in place of their traditional phone-based CTA. This switch, part of an A/B test conducted by Leadferno, resulted in a 201% boost in conversion rates, tripling their leads in just over a month.
For maximum impact, position your primary CTA above the fold so it’s immediately visible. Repeating it after major sections, like testimonials or service details, can also help. To make your CTA stand out, use bold, contrasting colors and apply the "squint test" - when you squint, your CTA should still grab attention. Keep the button text concise (3-4 words) and add a reassurance message nearby, such as "No credit card required" or "100% Satisfaction Guaranteed."
Once your CTAs are optimized, dive into how far visitors scroll through your page.
Scroll depth measures how far visitors navigate down your page, helping you confirm whether key sections - like service descriptions, testimonials, or pricing - are being seen. If visitors aren’t reaching these areas, consider moving them higher up.
A case study from 2024 highlights this issue. The Swedish security company Sensorem used Mouseflow to analyze scroll depth on their landing pages. They found that visitors from low-cost CPC campaigns rarely scrolled far enough to see their value proposition. By reallocating their budget to higher-quality traffic with deeper engagement, Sensorem doubled their conversion rate within six months.
Tamilore Sonaike, Content Strategist at Mouseflow, emphasizes the importance of engagement:
"A high engagement time suggests visitors find your site content interesting and valuable. They really consume it, interact with it, and that increases the likelihood of conversion."
Low scroll depth on a page with high traffic often signals a disconnect between your ad’s promise and the landing page content - or it may indicate low-intent visitors. For mobile users, tap maps can reveal whether buttons are too small or if other mobile-specific issues are causing friction.
To go even further, heatmaps can provide a visual breakdown of user behavior.
Heatmaps visually map where visitors click, scroll, and move their mouse, highlighting areas of high interaction and spots where interest drops off. Click maps, a type of heatmap, identify CTA hot spots and flag "ghost buttons" - elements that appear clickable but aren’t.
Click maps can also uncover "rage clicks", where users repeatedly click out of frustration. These often point to broken links or confusing design elements that need immediate fixes. Many tools now calculate a "friction score" by analyzing issues like rage clicks, click-errors, and mouse-outs, helping you quantify and address user frustration.
Susan Perez, Content Marketer at airSlate, explains the value of heatmaps:
"A heat map gives you an immediate visual cue as to where on the page the friction is occurring."
Heatmaps can also show whether users follow common scanning patterns, like the F-Pattern or Z-Pattern, which can guide the placement of key elements. Research has shown a strong link between mouse movement and eye movement, making heatmaps a cost-effective alternative to pricey eye-tracking studies. If heatmaps reveal that visitors are ignoring your primary CTA, consider adding visual cues like arrows or eye-direction graphics to draw attention.
To get the best return on investment (ROI) from your landing page campaigns, you need to understand traffic and cost metrics. While engagement metrics show how users interact with your site, traffic and cost metrics reveal which channels are bringing in the most valuable leads.
Not all traffic sources are created equal - each one delivers leads of varying quality. For example, traffic from organic search (via SEO) often leads to strong conversions because these visitors are actively searching for services like yours. However, building SEO rankings takes time and consistent effort. On the other hand, pay-per-click (PPC) ads on platforms like Google or Microsoft offer immediate visibility. The downside? They can be pricey. In the home services sector, the average cost per click is around $7.85, with some niches, like painting services, climbing to $13.74.
Local Services Ads (LSAs) are another option. These ads, marked with the "Google Guaranteed" badge, operate on a pay-per-lead basis. Guy Philosoph, Head of Product Management at LocaliQ, explains:
"LSAs are helping service-based businesses manage cost per lead volatility more effectively".
Your Google Business Profile is also a key player, driving local traffic by appearing in map results. This visibility translates into calls and clicks from nearby customers. Beyond search engines, social media platforms like Facebook and Instagram provide both paid and organic opportunities for engagement, while referrals from past customers often bring in leads who already trust your business.
The competition in home services is fierce. For example, there are about 180,000 monthly searches in the U.S. for "plumber near me" and 78,000 for "handyman." Adding to the challenge, 75% of home service businesses reported a rise in their cost per click by 2025. To stay ahead, track each channel carefully to identify the ones delivering the best results.
Once you’ve identified your traffic sources, the next step is to measure their cost efficiency.
To evaluate the efficiency of each channel, calculate your cost per lead (CPL). This is done by dividing your total marketing spend by the number of leads generated. Be sure to include all related expenses, such as ad spend, landing page design, agency fees, and tools like call tracking or A/B testing platforms. A lead is defined as a visitor who shares their contact information.
CPLs can vary widely depending on the trade and location. Here’s a breakdown of average CPL ranges for common home services:
| Service Type | Estimated CPL Range |
|---|---|
| Pressure Washing | $20 - $45 |
| Landscaping | $25 - $55 |
| Plumbing | $30 - $75 |
| HVAC | $35 - $95 |
| Roofing | $50 - $125 |
| Construction & Custom Trades | $50 - $150 |
A higher CPL is acceptable if the service has strong profit margins. Quality matters more than quantity - a $120 lead that consistently converts into a paying customer is far more valuable than a $30 lead that never responds. Tools like Estatehub help home service providers fine-tune their campaigns to lower CPL while keeping lead quality high through data-driven adjustments.
Mobile users behave differently from desktop users, so it’s crucial to track mobile conversion rates separately. While mobile often generates more traffic, desktop users tend to convert at higher rates. This makes optimizing for mobile a huge opportunity.
For home service providers, the click-to-call rate is especially important on mobile. Make sure your phone number is prominently displayed at the top of your page and is clickable for instant dialing. Tea Liarokapi from Moosend highlights:
"If your desktop audience converts well but your mobile audience doesn't, your mobile UX or load speed is likely the issue".
To improve mobile performance, simplify forms by reducing the number of fields, compress images to speed up loading times, and make sure your core value proposition and call-to-action are visible without requiring users to scroll.
Making small, focused changes to your landing page can lead to noticeable improvements in how well it converts visitors into leads. These tweaks don’t require a full redesign but can still drive meaningful results.
Forms are one of the most important tools for capturing leads. To maximize submissions, keep them simple - stick to just three fields: name, phone, and email. Why? Because 67% of users abandon forms before finishing them, and every extra field you add can lower completion rates by about 11%. In fact, forms with only three fields tend to convert at a rate of 25%, compared to 21% for forms with five fields.
Here’s a real-world example: In July 2025, Tommy Sugo boosted its conversion rate from 2.2% to 4.6% by changing its headline to "Perth's Fresh Pasta Specialists" and offering a free recipe pack as a lead magnet. As Matt Aird, CTO and Co-owner of Custom Neon, points out, being specific helps build trust.
For more detailed forms, consider using multi-step formats with progress indicators. This approach can increase conversions by up to 300% compared to long, single-page forms. Breaking a 10-field form into smaller steps - like "Step 1 of 3: Your Contact Info" - makes the process feel less overwhelming. Also, single-column layouts are faster to complete, saving users an average of 15.4 seconds compared to multi-column designs.
Don’t underestimate the power of your call-to-action (CTA). Use clear, action-driven labels like "Get My Free Quote" or "Schedule My Estimate" instead of generic terms like "Submit." These specific CTAs perform 18% better. For mobile users - who make up 82.9% of landing page traffic for service businesses - ensure your phone number is clickable so they can easily tap to call.
A high exit rate often means visitors aren’t finding what they expected. F5 Mortgage, for example, nearly doubled its conversion rate to 1.7% by changing its headline from a rate-focused message to one emphasizing benefits: "Own your dream home faster". As Dave Charest, Director of Small Business Success at Constant Contact, puts it:
"A homeowner with a burst pipe isn't browsing – they're scanning for help".
Make sure your page grabs attention fast - within 3 to 5 seconds. Display your unique selling proposition (USP) and primary CTA prominently above the fold. Trust signals, such as customer reviews, Better Business Bureau accreditation, or reassuring notes like "No credit card required", should be placed right next to your lead form. You can also use exit-intent popups to re-engage visitors as they move their cursor toward the close button. These popups can offer a simplified contact form or a free guide to encourage a last-minute conversion.
Once you’ve reduced your exit rate, focus on keeping visitors engaged longer to build trust and credibility.
The amount of time users spend on your page reflects how much trust they have in your content. This is especially important for high-consideration services, like HVAC repairs or roofing. Tea Liarokapi, a content creator at Moosend, explains:
"While bounce rate shows whether users stay or go, time on page indicates the quality of their attention once they've decided to stay".
Thrive Local saw a 38% increase in average time on page and a 45% boost in click-through rates to full case studies by redesigning their layout. They replaced dense text blocks with modular sections that highlighted key achievements. As founder Matt Bowman says:
"Visual hierarchy and bite-size proof points win. When people are looking for credibility and capability, less really is more".
To further increase engagement, consider adding explainer videos that showcase your team in action or video testimonials from happy customers. Use real before-and-after photos from your projects instead of stock images. Simplify your page by removing navigation menus and external links, keeping visitors focused on your offer. For those not ready to commit, provide a secondary action - like downloading a "Home Maintenance Checklist" - to keep them interested.
Focusing on landing page metrics can transform your marketing strategy, turning data into actionable insights that boost results. Consider this: the difference between an average conversion rate of 2.35% and a high-performing rate of 11.45% could double or even triple your leads - without increasing traffic. And with optimization efforts yielding an average ROI of 223%, the potential gains are undeniable.
The numbers don’t lie - making strategic adjustments pays off. Case studies have shown that refining your messaging to emphasize benefits and tailoring content to local audiences can drive noticeable improvements in conversion rates. What’s even better? These changes don’t require massive budgets - just focused effort informed by data about your audience's behavior.
Metrics like Cost Per Lead (CPL), conversion rate, and bounce rate are essential for identifying which channels deliver results and which ones drain resources. In industries like home services, where a missed call could mean losing out on $1,000 or more, even small improvements in landing page performance can translate into substantial revenue gains.
The gap between average and exceptional performance is where competitive advantages are built. While most companies spend $92 on acquiring traffic for every $1 on conversion optimization, those who focus on refining their landing pages reap far greater rewards. The lesson? Continuous, data-driven adjustments make all the difference.
Start simple: track your conversion rate, identify where visitors drop off, and test one change at a time. These small steps will guide smarter marketing decisions, helping you attract more leads, cut down on wasted ad spend, and grow your business with confidence.
If you're looking to increase conversions on your landing page, start by focusing on clear messaging. Your visitors should immediately understand what you're offering and why it benefits them. Pair this with a strong value proposition that emphasizes how your service or product solves their problem or meets their needs.
Design plays a huge role too. A visually appealing layout that's easy to navigate keeps visitors engaged. Ensure your page is mobile-friendly so it works well on any device - phones, tablets, or desktops. This is non-negotiable in today's mobile-first world.
When it comes to forms, keep them simple. Ask for only the most essential information to reduce friction. And don't underestimate the power of compelling call-to-actions (CTAs). Use action-oriented language that nudges visitors toward the next step, whether that's signing up, purchasing, or learning more.
Adding elements like testimonials, trust badges, or guarantees can help build trust and credibility, making visitors more likely to convert. Finally, treat your landing page as a work in progress. Regularly test different elements - like headlines, images, or CTAs - to see what resonates most with your audience. Small tweaks can lead to big results.
To reduce your landing page's bounce rate, focus on improving the user experience and making sure your page matches what visitors expect. Start with page loading speed - nobody likes waiting for a slow page to load, and many will leave if it takes too long.
Make the above-the-fold section count by creating a visually appealing and informative area that grabs attention right away. It should clearly communicate your value and give visitors a reason to stay. Also, ensure your messaging flows seamlessly from your ads to your landing page. This consistency reassures users that they've landed in the right spot.
With so many people browsing on their phones, a mobile-friendly design is non-negotiable. Use a clean and intuitive layout that naturally guides visitors through the page. Add social proof, like customer reviews or testimonials, to build trust. Finally, include clear and compelling calls-to-action (CTAs) that make it easy for users to engage. Even small tweaks in these areas can go a long way in keeping visitors on your page.
Page load time plays a huge role in the success of your landing page. It directly impacts user experience, bounce rates, and - most importantly - conversions. People expect pages to load fast. Even a delay of just a few seconds can lead to frustration and, worse, lost leads.
This is especially true for home service providers, where competition is fierce and first impressions count. If your page takes too long to load, potential customers might not stick around - they’ll head straight to your competitors. A fast-loading landing page keeps visitors engaged and increases the chances of turning clicks into actual customers.
Sign up for the newsletter and be the first to read our articles.


Every single person on our agency team has spent a lot of time in the field either running their own business or working for larger marketing agencies. We have all put in the time responding to leads, helping customers, scheduling and doing services. This gives us a massive advantage when making decisions.
One thing that has always been very special to us, is the fact that (excluding spam / people that never used our services) we do not have any bad reviews. This absolutely does not mean we have never had unhappy clients, but if it happens, we make it right, and stand behind our promises.
We have seen, time and time again, other agencies using strategies and structuring campaigns the way that they are technically supposed to. Most of these "best practices" that are taught in our industry, simply do not transfer into local lead gen. This is partially because we do have a much different target audience, and are typically spending less, however optimizing for website traffic does not work here.
We have been there, jumping into starting a home service business, struggling, and doing everything wrong. It's humbling. Our team has all felt the highs and lows, which is why we get so excited for our clients to win, we know how good it feels.

Estatehub is not a normal agency, we know "clicks" don't get you sales. Let us show you how lead gen experts do it.

