

Overview of Common Stains
Full overview of the most common stains, including how to identify them and treat them
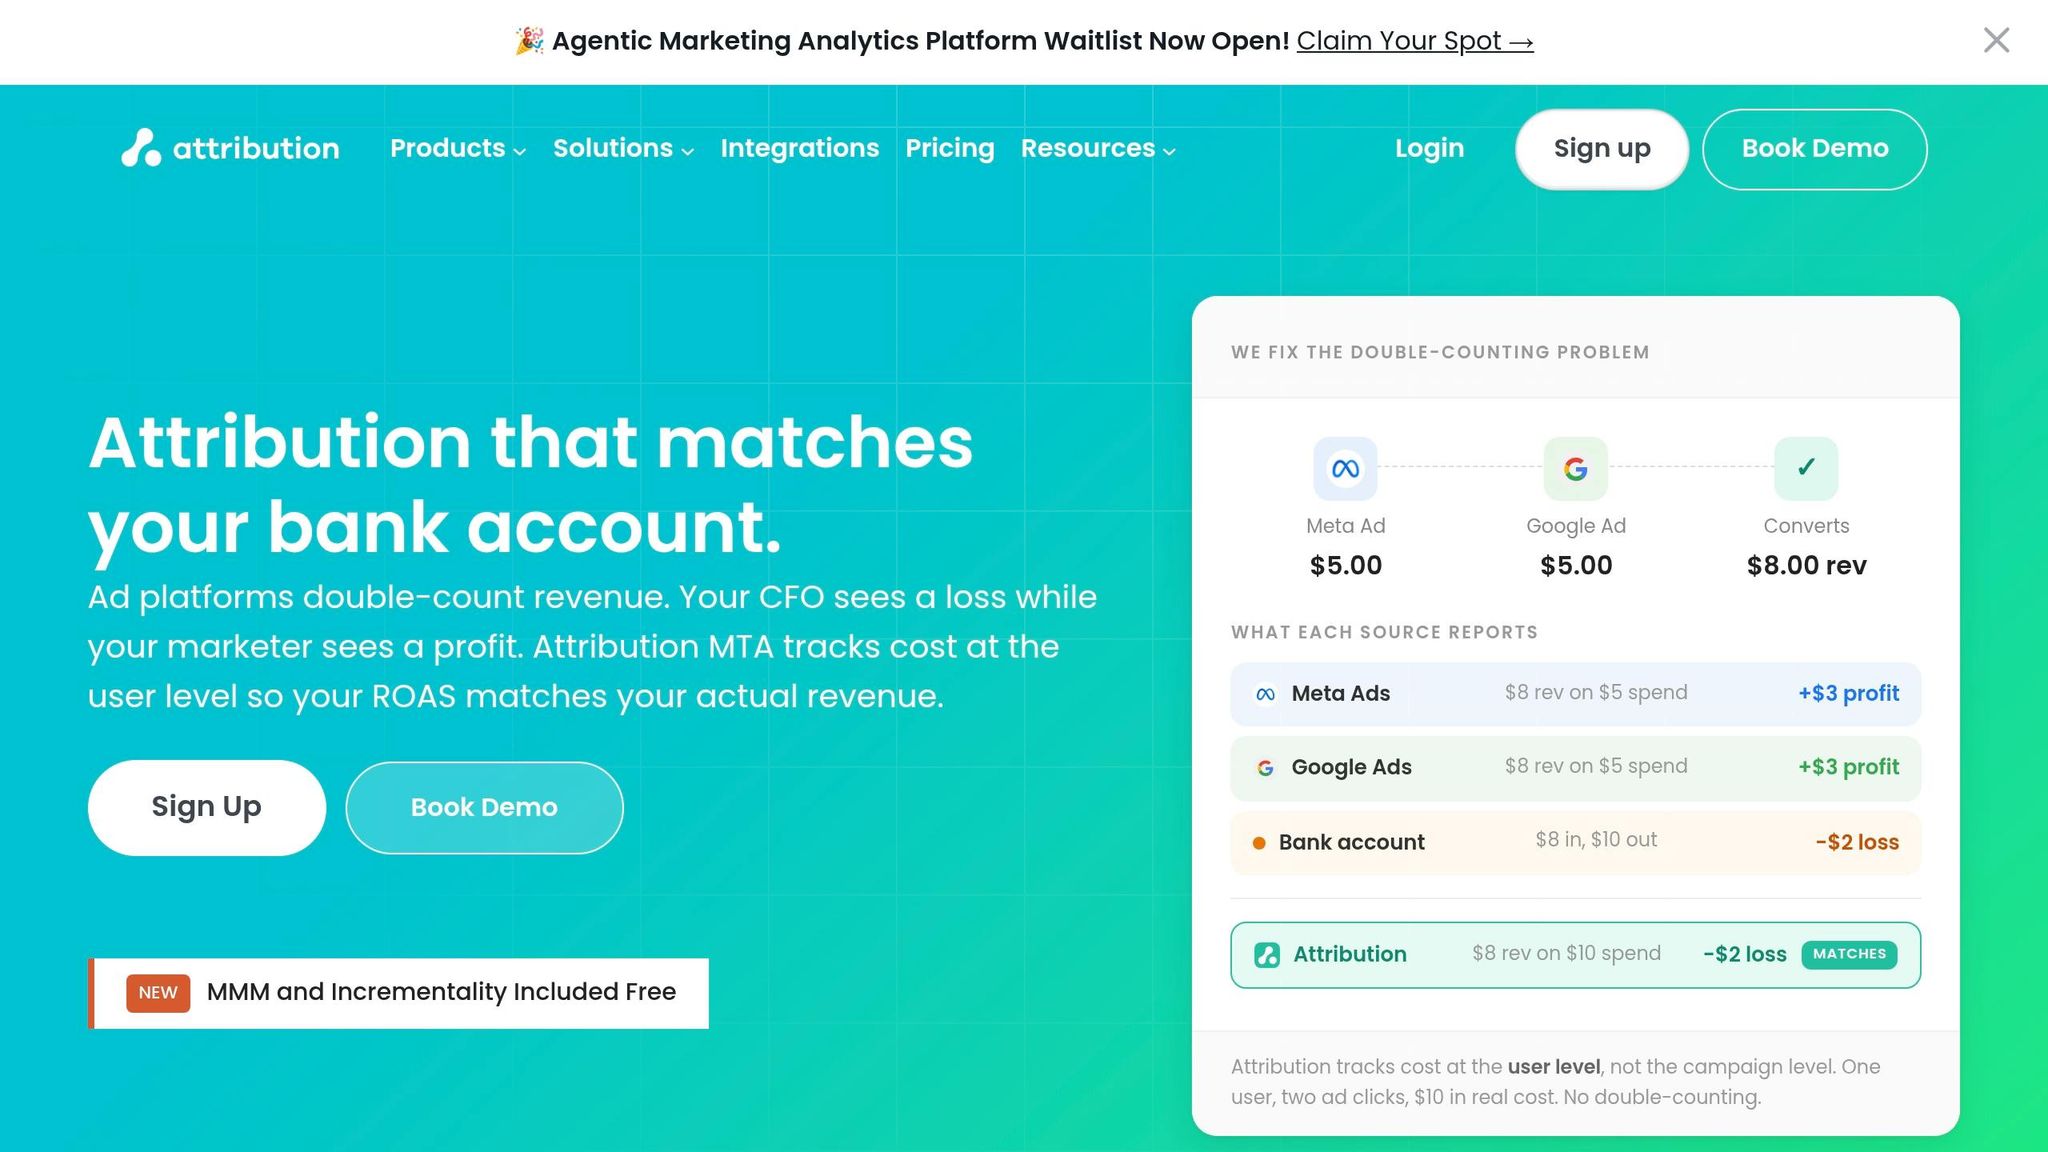
When homeowners choose a service, their decision often involves multiple steps - like clicking ads, seeing signs, or reading reviews. Traditional single-touch attribution credits just one interaction, missing the full picture. Multi-touch attribution (MTA) solves this by assigning credit to every touchpoint, helping you understand which channels truly drive results.
Here's why MTA matters:
Five MTA models to know:
Each model has strengths and weaknesses, making it important to choose one that aligns with your business type and sales cycle. For example, time-decay works well for urgent services, while W-shaped suits high-cost projects like kitchen renovations.
Start simple, use tools like call tracking, and experiment with models to see what works best for your goals.
The linear attribution model steps away from the limitations of single-touch approaches by giving equal credit to every interaction in the customer journey. It splits the conversion value evenly across all touchpoints. For instance, if a homeowner engages with five marketing channels before booking your service, each channel gets an equal share of the conversion credit.
To make this work effectively, accurate call tracking is a must. Let’s say a customer calls after noticing your truck wrap, clicking on a Google Ad, and visiting your website. The linear model ensures that all three touchpoints are credited equally. For a job that brings in $2,000, each channel would be attributed approximately $666.67 in revenue.
The linear model is particularly suited for situations where multiple interactions play a role over time, such as routine maintenance services like janitorial contracts or seasonal HVAC tune-ups. It’s also helpful when homeowners take weeks or months to make a decision - like selecting a landscaping company for a backyard renovation. For businesses just starting with multi-touch attribution (MTA), this model strikes a balance: it’s simple enough to implement while offering a more balanced perspective than single-touch models.
One of the key benefits of the linear model is its balanced approach. It ensures no single channel gets over-credited.
"The strength of the linear model is its fairness and simplicity. Every touchpoint is treated as equally important, which prevents the biases inherent in single-touch models" - KISSmetrics
This fairness allows businesses to see how different marketing efforts - like SEO, truck wraps, and direct mail - work together to drive conversions. For teams or stakeholders looking for a straightforward reporting method, the linear model offers clarity without requiring advanced analytics skills.
However, this model does come with its drawbacks. By giving equal weight to every interaction, it can mask the influence of key touchpoints. Jane Irene Kelly from Invoca highlights this issue:
"The downside of this model is that each touchpoint gets equal credit, whether it is a high- or low-value touchpoint, so your ability to identify and optimize for the most influential interactions in the customer journey is limited" - Jane Irene Kelly, Invoca
This limitation can make it harder to pinpoint which channels are driving the most value and deserve more investment. For businesses looking to fine-tune their marketing budget, the linear model may fall short in delivering the detailed insights needed for precise optimization. Still, its simplicity makes it a good starting point for exploring more advanced attribution methods.
Next, we’ll look at a model that places greater emphasis on recent interactions.
The time-decay attribution model operates on a straightforward idea: the closer a touchpoint is to the conversion event, the more credit it earns. This is calculated using an exponential decay formula with a "half-life" parameter. The formula is W(t) = W × (1/2)^(t/t_half), where t represents the time in days and t_half is the half-life.
Here's how it works in practice: with a 7-day half-life, a touchpoint 7 days before conversion gets 50% of the credit compared to one occurring on the conversion day. A touchpoint 14 days prior would only receive 25%. For instance, imagine a home service job worth $3,000. A homeowner clicks a Google ad 14 days ago, visits the website 7 days ago, and finally calls after seeing a retargeting ad. In this case, the retargeting ad would get the largest share of credit.
The time-decay model fits perfectly for home service businesses with medium-to-long sales cycles, such as roofing projects (approximately 3 months) or kitchen remodeling (up to 6 months). While early-stage awareness campaigns are essential, recent actions - like reading reviews or performing a "near me" search - often play a more direct role in prompting a call.
"For most home service businesses, time decay attribution is the sweet spot. It is simple enough to implement, accurate enough to make decisions, and does not require enterprise-level data volume." – BKND
To align with these sales cycles, set your lookback window to 60–90 days. This ensures the model reflects the actual timeline of customer decision-making.
The time-decay model strikes a balance by giving some credit to early awareness activities while focusing on the interactions that directly lead to conversions. Unlike last-click attribution - which assigns all credit to the final touchpoint - this method captures the complexity of a homeowner's journey. It's also a practical choice for smaller businesses; while data-driven models often need at least 600 conversions in 30 days, time-decay works well with smaller datasets.
One downside of the time-decay model is that it tends to undervalue top-of-funnel efforts. For example, a social media campaign that first introduces a homeowner to your service months before the conversion might receive minimal credit because of the time gap. Additionally, this model doesn't account for interaction quality - a quick ad click is weighed the same as a detailed video view if they occur around the same time. Without proper call tracking, phone calls (preferred by 68% of consumers for urgent needs) can be misclassified as direct traffic, disrupting the attribution chain.
To get the most out of this model, experiment with half-life values of 7, 14, and 30 days to see how rankings for your channels change. If the rankings remain consistent, your setup is solid. Adjust the half-life to fit your sales cycle - for instance, use 7–14 days for urgent services like emergency plumbing, and 14–30 days for more planned services like HVAC installations. This alignment ensures the model mirrors your customers' behavior and enhances campaign planning.
Next, we’ll dive into the Position-Based (U-Shaped) Attribution Model, which assigns distinct roles to each touchpoint.
The U-shaped attribution model assigns 40% of the credit to the first touchpoint and 40% to the last touchpoint, with the remaining 20% divided evenly among all interactions in between.
For instance, imagine a homeowner notices your Facebook ad promoting roof inspections (first touch), later reads reviews on your website, checks out your service area page, and finally searches for your company name on Google before making a call (last touch). In this case, 40% of the credit goes to the Facebook ad, another 40% to the phone call from the Google search, while the two intermediary actions share the remaining 20%.
This model is particularly effective for lead generation, making it a solid choice for service providers looking to balance brand awareness with conversion efforts. By connecting the discovery phase with the final conversion, the U-shaped model emphasizes both ends of the customer journey.
"Position-based attribution, often referred to as the U-shaped model, allocates a more substantial proportion of the conversion credit to the initial and concluding points of contact." – Andrei Kholkin, Founder, Weberlo
The U-shaped model stands out by giving credit to both the first interaction that sparks interest and the final interaction that seals the deal. Unlike single-touch models, which focus on just one point in the customer journey, this approach provides a more balanced view. It allows businesses to allocate their marketing budgets more effectively, investing in channels that drive awareness while also supporting those that convert leads into customers.
For home service providers, this model aligns well with consumer behavior. Since 68% of customers prefer to call businesses for urgent needs, the U-shaped model highlights the importance of the final call as a key conversion point while still acknowledging the initial touchpoint that started the journey.
Despite its strengths, the U-shaped model has some drawbacks. By allocating only 20% of the credit to intermediary actions, it may undervalue crucial steps like reading testimonials or engaging with educational content - steps that often play a significant role in building trust. For example, when a homeowner is considering a when a homeowner is considering a $15,000 kitchen remodel,5,000 kitchen remodel, they’re likely to spend considerable time researching, yet these nurturing interactions share only a small portion of the credit.
Another challenge is tracking offline interactions. Without robust call tracking systems or identity resolution tools, offline touchpoints might go unrecorded, leading to gaps in attribution data and an incomplete understanding of what truly drives conversions.
"If you are not changing budgets, channel strategy, creative, or nurture flows, then attribution is just a very expensive way to make charts." – Vrushti Oza, Factors.ai
To maximize the effectiveness of the U-shaped model, it’s a good idea to periodically compare its insights with first-click and last-click data. This helps ensure that no important steps in the customer journey are being overlooked.
The W-shaped attribution model stands out by focusing on three pivotal moments in the customer journey. It assigns 30% of the credit to the first touchpoint (where awareness begins), 30% to lead conversion (when a prospect provides their contact details), and 30% to opportunity creation (when a potential customer shows clear buying intent). The remaining 10% is evenly distributed across all other interactions along the way.
For instance, imagine a homeowner who first encounters a digital ad, then fills out a "Request a Quote" form, and later schedules an on-site consultation. Each of these steps would receive 30% of the credit. Meanwhile, any additional activities - like reading blog posts or checking out service area pages - would share the last 10%. This approach uniquely emphasizes key conversion milestones, setting it apart from simpler attribution models.
The W-shaped model is particularly suited for high-cost services with longer decision-making cycles, such as roof replacements, kitchen renovations, or HVAC system installations. These are scenarios where homeowners often take their time to research before committing to a significant investment. This model excels at identifying which pieces of content or campaigns play a role in moving prospects from casual interest to qualified sales opportunities.
"This model is appropriate for many B2B sales processes, particularly ones with a heavy request for proposal (RFP) process that turns leads into opportunities." – Alexander Stegall, Director of Analytic & Strategic Services, Oracle Digital Experience Agency
The W-shaped model offers a detailed look at the customer journey, especially in tracking how prospects transition into qualified leads. Unlike simpler models that may ignore critical mid-funnel interactions, this approach ensures that moments like requesting a quote or scheduling a consultation are given proper weight. This is vital for home services, where 68% of consumers prefer to call businesses for urgent needs. When paired with effective call tracking systems, the model can highlight the value of these high-impact phone calls.
Businesses using the W-shaped model often report a 15–18% increase in revenue and a 15–30% improvement in campaign efficiency. It helps home service providers understand which channels are driving meaningful actions, such as phone inquiries, rather than just tracking website visits.
While powerful, the W-shaped model does come with its challenges. It requires advanced tracking tools and tight CRM integration to pinpoint the "lead conversion" and "opportunity creation" stages. For services with quick, straightforward customer journeys - like emergency lockouts or drain cleaning - this level of detail can feel excessive.
Another drawback is that it may undervalue content that falls outside the three main milestones. Without tools like Dynamic Number Insertion (DNI) to track phone leads, businesses could miss out on 40–70% of their conversion data. To ensure accuracy, it’s critical to configure the CRM properly to capture the "Lead" and "Opportunity" stages and maintain clean, organized data.
The data-driven attribution model takes a completely different approach compared to traditional rule-based models. Instead of assigning fixed percentages like "30% to the first touch" or "40% to the last touch", it leverages algorithms and statistical analysis to evaluate your actual historical data. This allows it to pinpoint which touchpoints genuinely drive conversions.
Techniques like Shapley value analysis and Markov chain models are used to assess each touchpoint's impact. For example, the model might reveal that a Google Ad followed by a phone call consistently results in booked jobs, while a Facebook ad followed by a form submission rarely leads to conversions. Based on these patterns, the credit distribution adapts automatically.
What sets this model apart is its ability to include offline data, giving significant weight to phone calls - often the most critical conversion points. Instead of focusing solely on "cost per lead", it shifts the emphasis to "cost per sale" and "revenue per source", ensuring that the channels responsible for high-value jobs receive appropriate credit. As Estatehub explains:
"We know clicks don't turn into sales... we are always making optimizations towards whats bringing you in quality leads, and whats generating you the most revenue".
This dynamic approach ensures that credit aligns with actual conversion patterns rather than theoretical assumptions.
This model is particularly effective for businesses managing complex, multi-channel campaigns with a high volume of data. It’s especially useful when scaling across multiple lead sources to determine which channels bring in the most profitable customers - not just the most leads. For instance, a lead source producing $80 leads with a 40% close rate (yielding $200 per sale) is far more efficient than one generating $50 leads with only a 10% close rate (resulting in $500 per sale).
It’s ideal for industries with longer sales cycles, such as commercial landscaping or major home renovations, where customers interact with multiple touchpoints before making a decision. However, there’s a catch: to achieve statistically reliable results, you generally need at least 300 to 500 conversions per month with complete journey tracking.
The biggest strength of this model is its accuracy, as it removes the biases inherent in fixed-rule models. KISSmetrics highlights this benefit:
"Data-driven models have the potential to be the most accurate because they are calibrated to your actual data rather than theoretical assumptions".
By adopting this approach, many companies find they can reallocate 15% to 30% of their budget and see a positive ROI. For home service businesses, this means identifying which marketing channels actually generate revenue rather than just drawing attention. Additionally, the model accounts for the longer sales cycles common in home services - like a lead from organic search that might take 60 days to close - by tracking customer cohorts over time instead of relying on short-term snapshots.
Despite its precision, the data-driven model comes with challenges. The most significant hurdle is its complexity. Implementing it requires advanced tracking systems, machine learning tools, and a large volume of data - resources that many home service businesses might lack. Without at least 300–500 conversions per month, the results can be inconsistent.
The model also relies heavily on the quality of your data. If your sales team doesn’t consistently record how customers found you, or if your system can’t connect multiple sessions from the same user across devices, the results might be unreliable. Setting up proper phone tracking is especially crucial.
Finally, while the model provides valuable insights, it shouldn’t operate entirely on autopilot. Use its findings to guide budget decisions, but always combine those insights with qualitative business context for the best outcomes.

Multi-Touch Attribution Models Comparison for Home Services
Understanding the trade-offs between different attribution models can help home service marketers fine-tune their strategies to make the most of every customer interaction. The table below outlines the main advantages and drawbacks of each model, followed by a deeper dive into their practical implications.
| Model Name | Pros | Cons |
|---|---|---|
| Linear | Simple to implement; gives a balanced view of the entire customer journey; works well for longer decision-making processes. | Treats all touchpoints equally, even those with minimal impact; makes budget optimization challenging. |
| Time-Decay | Perfect for short-term campaigns; emphasizes recent interactions, reflecting high intent. | Undervalues early-stage channels like SEO or awareness campaigns that initially attract leads. |
| Position-Based (U-Shaped) | Strikes a balance between discovery and conversion; ideal for lead generation. | Neglects the nurturing phase; gives minimal credit to interactions in the middle of the journey. |
| W-Shaped | Covers awareness, lead generation, and conversion; highlights channels that nurture leads effectively. | Difficult to implement; requires advanced CRM integration to track lead creation accurately. |
| Data-Driven | Delivers high accuracy; removes human bias; adapts automatically to shifting customer behavior. | Requires a large volume of data (600+ conversions/month); its "black box" nature can make it hard to explain to stakeholders. |
Linear attribution ensures that all touchpoints in the customer journey receive credit, making it a straightforward choice. However, it doesn’t provide clarity on which interactions yield the highest ROI, which can complicate budget decisions.
Time-decay attribution prioritizes the final steps of the journey, making it ideal for campaigns focused on closing sales. However, this model risks underfunding early-stage efforts like SEO or local ads, which are crucial for bringing in potential customers. For those needing immediate growth, aggressive lead generation can complement these long-term efforts.
Position-based attribution (U-shaped) shines when balancing brand awareness with lead generation. It’s particularly effective for businesses using multiple online advertising platforms. However, it often overlooks the nurturing phase, leaving middle-touch interactions under-credited.
W-shaped attribution takes things a step further by emphasizing the lead creation moment, offering a broader perspective across the customer journey. While it’s highly insightful, its complexity and reliance on sophisticated tracking systems can make it a challenge for smaller businesses to implement.
Data-driven attribution stands out for its precision, analyzing actual conversion data to allocate credit. As Charwin Vanryck deGroot from BKND notes:
"Perfect attribution is a fantasy. Functional attribution is achievable".
That said, Google’s data-driven model requires at least 600 conversions within 30 days to perform effectively, which may be a hurdle for many home service companies.
These insights reinforce the need for tools like call tracking and customer journey mapping to optimize campaigns. Choosing the right model depends on factors like your service type, sales cycle, and the data you have available.
Aligning your attribution model with your service type and sales cycle is key. For emergency services like plumbing or HVAC repairs - where customers typically act within 7–14 days - time-decay or last-touch models work best. On the other hand, high-ticket projects like kitchen remodeling or commercial landscaping benefit from position-based (U-shaped) or W-shaped models, which account for longer decision-making processes with multiple quote requests. Companies leveraging multi-touch attribution often see budget efficiency improve by 15% to 30% compared to single-touch models. Additionally, robust call tracking - whether through dynamic number insertion (DNI) or static tracking numbers on marketing materials like yard signs and truck wraps - helps capture essential lead source data.
If you're new to attribution, starting simple is a smart move. The U-shaped model is a solid choice for many home service providers because it balances brand awareness with lead generation without requiring massive amounts of data. Ryan Koonce, CEO of Attribution, highlights its importance:
"Multi-channel attribution bridges gaps in long buyer cycles by showing cost and credit allocation, proving marketing value to revenue".
To make this actionable, set your attribution window to match your typical sales cycle. For emergency repairs, a 7–14 day window is appropriate. Routine maintenance might need around 30 days, while larger residential or B2B projects could require 90 days or more. Consider running a 30-day experiment comparing two models side-by-side to determine which one aligns best with your goals before fully committing. Also, tracking leads all the way to the final invoice - not just the initial contact - will help you accurately calculate the true cost per sale. This enables you to shift your budget away from underperforming channels and toward those delivering the best results.
To get started with multi-touch attribution, you need to gather tracking data from every customer interaction point. This means capturing online data through tools like UTM parameters and call tracking, while also accounting for offline efforts, such as yard signs or direct mail campaigns. By collecting this information, you can piece together the full customer journey - from the first moment of awareness to the final conversion - providing a clearer picture for better analysis.
To select the right attribution model, take a close look at your customer journey across various touchpoints - this could include digital ads, phone calls, or even in-person interactions. Consider models such as linear attribution, which spreads credit evenly across all touchpoints; time decay, which gives more weight to recent interactions; or data-driven models, which rely on analytics to assign credit based on actual performance.
Leverage tools like call tracking, UTM parameters, and CRM integrations to track and measure these interactions effectively. The best attribution model is one that aligns with your sales cycle and provides insights to help you make smarter decisions about your marketing budget.
Call tracking tools are a smart way to assign unique phone numbers to different marketing channels. By doing this, you can track which campaigns or platforms are driving calls to your business. These tools often integrate with your CRM and leverage UTM parameters to tie calls back to specific campaigns, making attribution much more precise.
Want extra insights? Simply ask callers, "How did you hear about us?" This straightforward question can reveal valuable information about your audience and their journey.
The cost for call tracking typically ranges between $50 and $100 per month, but the benefits - like improved lead attribution and a clearer picture of your marketing ROI - make it a worthwhile investment.
Sign up for the newsletter and be the first to read our articles.


Every single person on our agency team has spent a lot of time in the field either running their own business or working for larger marketing agencies. We have all put in the time responding to leads, helping customers, scheduling and doing services. This gives us a massive advantage when making decisions.
One thing that has always been very special to us, is the fact that (excluding spam / people that never used our services) we do not have any bad reviews. This absolutely does not mean we have never had unhappy clients, but if it happens, we make it right, and stand behind our promises.
We have seen, time and time again, other agencies using strategies and structuring campaigns the way that they are technically supposed to. Most of these "best practices" that are taught in our industry, simply do not transfer into local lead gen. This is partially because we do have a much different target audience, and are typically spending less, however optimizing for website traffic does not work here.
We have been there, jumping into starting a home service business, struggling, and doing everything wrong. It's humbling. Our team has all felt the highs and lows, which is why we get so excited for our clients to win, we know how good it feels.

Estatehub is not a normal agency, we know "clicks" don't get you sales. Let us show you how lead gen experts do it.

