

Overview of Common Stains
Full overview of the most common stains, including how to identify them and treat them
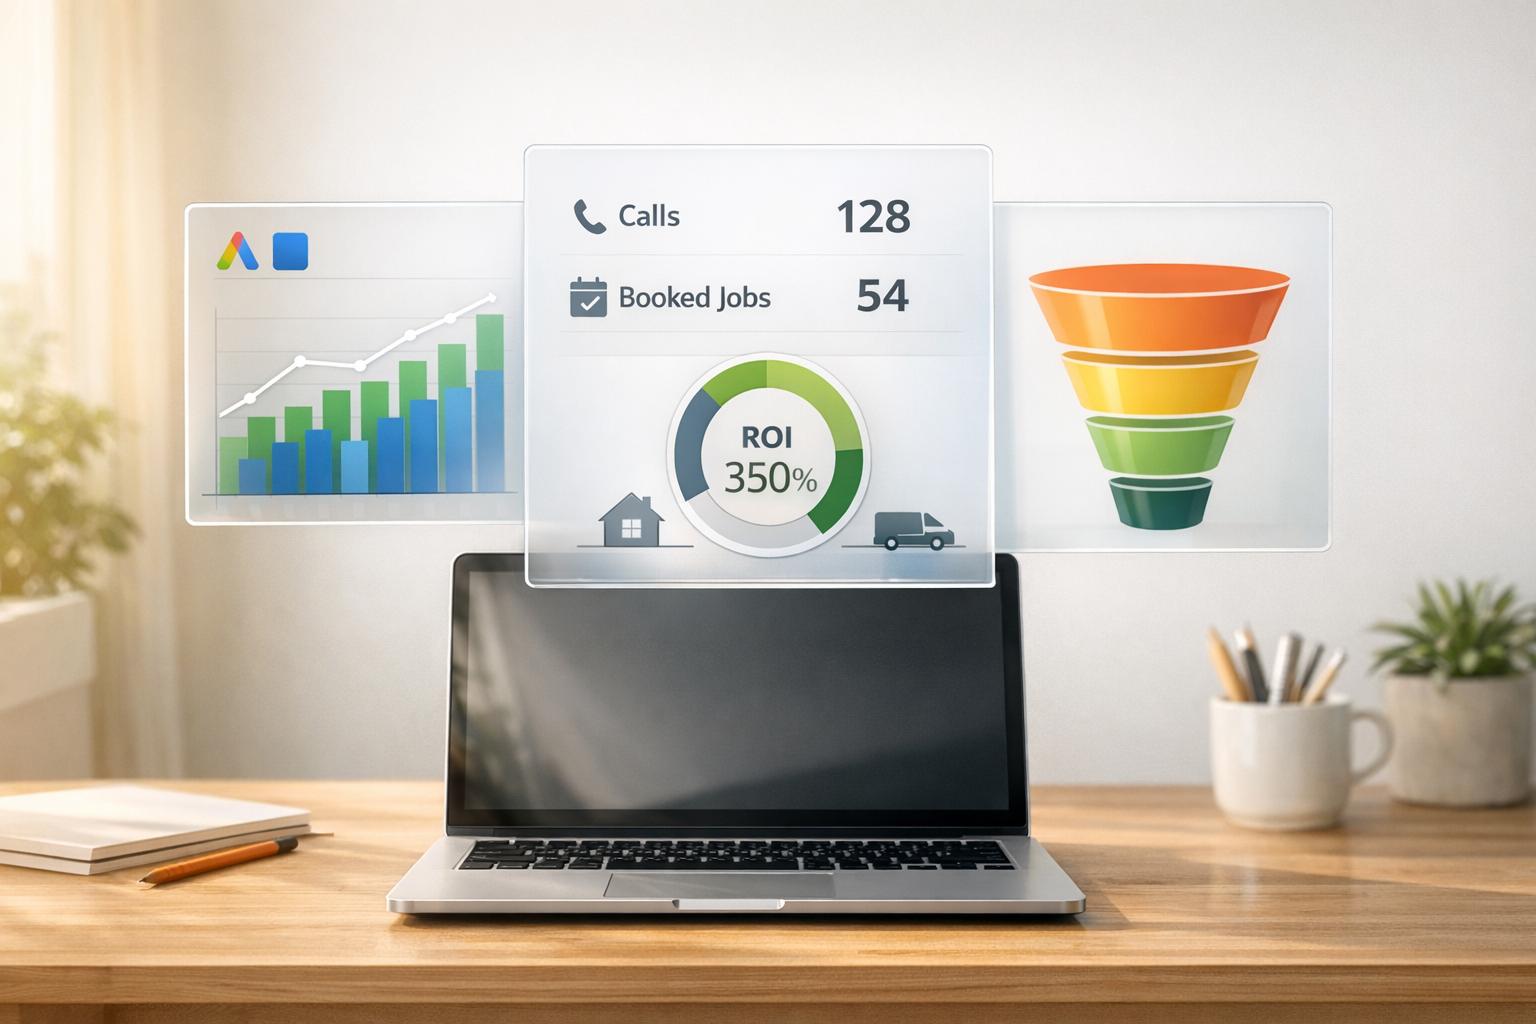
Running ads on Google and Facebook without proper reporting is like driving without a map - you’ll waste time and money without knowing what’s working. Social media reporting tools simplify this process by centralizing data, automating reports, and focusing on metrics that matter, like cost per lead and cost per booked job. For home service businesses, where every dollar counts, these tools help track performance and ensure ad spend leads to real results, not just vanity metrics.
Key takeaways:
The right tools and tracking systems turn raw data into actionable insights, helping you make smarter decisions about your ad campaigns.

Google & Facebook Ads Benchmarks for Home Service Businesses
When it comes to running ad campaigns, having clear, outcome-driven goals is the foundation for success. Pair that with precise tracking, and you’ll have the tools to make smarter decisions about your ad spend.
Before diving into the data, it’s crucial to define what you want your campaigns to achieve. For home service businesses, this means focusing on results that matter - like booked jobs or estimate requests - rather than just clicks or traffic.
Each platform works best for different objectives. For Google Ads, aim for high-intent actions like booked calls or estimate requests. On the other hand, Meta Ads (Facebook and Instagram) are better for generating demand and capturing a broader pool of leads.
Here’s why this distinction is important: Google Search campaigns tend to drive leads with higher intent, which means they close at a rate of 15–28%. Meanwhile, Meta leads close at a lower rate, around 8–15%, but they can help fill the top of your sales funnel with more volume.
Once you’ve set your goals, focus on metrics that reflect actual performance. While standard metrics like CTR (click-through rate), CPC (cost per click), and CPA (cost per acquisition) are helpful, they don’t tell the full story for home service businesses.
Here’s a quick look at the industry benchmarks for Google Ads in the home services sector:
| Metric | Home Services Average |
|---|---|
| Cost Per Click (CPC) | $7.85 |
| Click-Through Rate (CTR) | 6.37% |
| Conversion Rate (CVR) | 7.33% |
| Cost Per Lead (CPL) | $90.92 |
(Source:)
Keep in mind that these averages can vary depending on your trade. For instance:
Knowing these benchmarks gives you a baseline to measure your performance and spot when things are off.
But the most critical metric for home service businesses isn’t cost per lead - it’s cost per booked job.
"The metric that matters is cost per booked job by channel, not cost per lead." - Rivet
Since 60–80% of home service conversions happen over the phone, tracking phone calls is essential. For Google Ads, set calls lasting 60 seconds or more as conversions to weed out low-quality inquiries. If you’re in roofing, consider increasing that threshold to 90 seconds, as qualifying these higher-ticket jobs often takes more time.
How often you review your campaign performance can impact your ability to make adjustments. Checking too frequently - like daily - can lead to overreacting to short-term fluctuations. On the other hand, waiting too long, like only reviewing quarterly, could cause you to miss critical opportunities.
Here’s a balanced approach:
It’s also important to give new campaigns enough time to settle. The first 30 days are primarily about gathering data. You’ll typically need 60–90 days to identify reliable trends and confidently adjust budgets between platforms like Google and Facebook.
"Month 1 is crucial in gathering data for your campaign, it gives us the feedback we need to make the most impactful changes." - Estatehub
Seasonality also plays a role in how often you should monitor campaigns. During peak times - like summer for HVAC, spring for roofing, or winter for plumbing emergencies - daily budget checks can help you avoid overspending or missing opportunities.
With your goals and metrics locked in, the next step is ensuring your tracking system is set up to capture accurate data.
Once you've defined your goals and metrics, the next step is ensuring your tracking systems are set up correctly. Misconfigured tracking can lead to inaccurate data, which can derail even the best campaigns. Here's how to get your tracking aligned across Google Ads, GA4, and Meta platforms for precise data collection.
"If your conversion tracking is broken, nothing else matters. Not your bidding strategy. Not your keyword selection. Not your ad copy." - Alexander Perleman, Head of Product, groas
Start by linking your GA4 property to Google Ads. Go to Admin > Product Links > Google Ads Links in GA4 and enable both Personalized Advertising and Auto-Tagging. Auto-tagging adds a GCLID (Google Click ID) to your URLs, which ties sessions back to specific campaigns.
Next, identify your key actions - like generate_lead or phone_call - and mark them as Key Events in GA4. Import these events into Google Ads through Tools > Data Manager > Connected Products. Be careful to assign only one Primary source for each conversion. Using both a Google Ads tag and an imported GA4 event as Primary for the same action will result in double-counted conversions, skewing your bidding data.
For home service businesses, where phone calls are a major conversion method, you can set up phone calls as a conversion action. Deploy tags using Google Tag Manager (GTM) to avoid manual code edits. To ensure everything is working, use the Google Tag Assistant browser extension to confirm tags are firing correctly, preferably on a thank-you page or after a call confirmation.
In Meta's Events Manager, create and install your pixel via GTM or direct site integration. After installation, set up standard events that align with your business objectives. For home service providers, key events often include Lead (form submission), Schedule (calendar booking), and PageView (for retargeting audiences).
However, browser pixels alone aren't enough anymore. Privacy restrictions, like iOS updates and ad blockers, can lead to lost conversion data. To address this, implement the Conversions API (CAPI). This tool sends event data directly from your server to Meta, bypassing browser limitations. Advertisers using CAPI often see a 17.8% lower cost per result and recover 10–25% more conversions that would otherwise go untracked. For those without a developer, Meta provides a one-click CAPI setup in Events Manager, hosted for free.
If you're running both the Pixel and CAPI, make sure to pass a shared event_id for each event to avoid duplicate reporting. Additionally, verify your domain in Business Manager early on, as unverified domains have limited tracking capabilities for iOS traffic.
With tracking configured on both Google and Meta platforms, you're ready to centralize your data.
Once your tracking systems are in place, it's time to unify your data. Relying solely on native platform reports can be misleading since each platform often claims credit for the same conversions. In some cases, reported numbers may be 2x to 4x higher than the actual results.
Using GA4 as a neutral source for attribution can help. GA4 tracks the entire user journey across channels, reducing duplicate conversion counts from multiple platforms. To further simplify reporting, tools like Looker Studio or Google Sheets (with add-ons like SyncWith, used by over 100,000 marketers) allow you to pull data from all platforms into a single dashboard via API connections.
For consistency, use standardized UTM parameters across all your ads. At a minimum, include utm_source, utm_medium, and utm_campaign. Most connectors require utm_medium=cpc to align paid ad data with GA4 sessions. Automate updates by setting up scheduled refreshes so your dashboard stays current without manual intervention.
"Allocating more budget to the platform with the best reported CPA - without a neutral attribution source - means concentrating spend on whichever platform claims the most credit, not whichever platform is actually driving the most incremental conversions." - Synter
Once your tracking is set up and data starts flowing, the next step is turning that information into actionable insights. A well-designed dashboard can save you time and show exactly where your ad spend is paying off. In fact, automated dashboards can free up as much as 15 hours per week for marketing teams, while unified views enable decisions up to three times faster compared to switching between individual platform tools. Let’s dive into how to create dashboards tailored to each advertising platform.
Each advertising platform provides different insights, so it’s smart to create separate dashboards for platforms like Google Ads and Meta Ads.
For your Google Ads dashboard, focus on metrics like keyword performance, match types, spend, conversions, and search terms. Regularly reviewing search terms can uncover negative keyword opportunities, helping you reduce wasted ad spend quickly.
For your Meta Ads dashboard, shift your focus to reach, frequency, and demographic data such as age, gender, and location. This ensures your ads are targeting the right homeowners within your service area.
To keep things manageable, limit each dashboard view to 8–12 metrics. Overloading dashboards with too many KPIs can make it hard to identify actionable insights.
"The most common dashboard failure is including too many metrics. When a dashboard shows 30+ KPIs on a single screen, it communicates nothing." - 1ClickReport
After setting up platform-specific dashboards, an executive summary dashboard provides a high-level overview of performance. These dashboards should highlight key results like Total Spend, Conversions, Cost Per Lead (CPL), and Return on Ad Spend (ROAS), with trend indicators for quick, under-a-minute reviews. Use large scorecards to make these metrics stand out.
For home service businesses, it’s important to include offline conversions - such as phone calls and booked appointments - in addition to form submissions. Adding a period-over-period comparison (e.g., this month versus last month) can help you immediately spot performance changes. If your account spends more than $20,000 per month, consider creating weekly summaries for more frequent updates.
| Dashboard Widget | What It Shows | Why It Matters for Home Services |
|---|---|---|
| Cross-Platform KPIs | ROAS, CPA, CPL, Total Spend | Compares efficiency across Google and Meta at a glance |
| Budget Health | Spend utilization and pacing | Identifies overspending or underspending early |
| Conversion Breakdown | Calls, form leads, bookings | Tracks the actions that directly drive revenue |
| Period-over-Period | Current vs. prior period trends | Highlights improvements or declines in performance |
In addition to an executive summary, a detailed view can help you identify specific areas for improvement. Geographic data, for example, is incredibly useful - breaking down ROAS and CPL by city or ZIP code can reveal high-performing areas where you should focus more budget. If one neighborhood consistently delivers lower costs per lead, it’s a clear sign to prioritize that area in your next campaign.
On the creative side, ranking active ads by conversion rate can help you catch creative fatigue - a common issue when ad frequency increases while ROAS drops. Use conditional formatting (like red for high CPA and green for strong ROAS) in your performance tables so underperforming elements stand out right away.
"Data isn't just a report card, it's your roadmap." - Hop Skip Media
Once your dashboards are up and running, it's time to use the insights they provide to fine-tune your ad campaigns.
Spot your best-performing campaigns by looking for those with a low cost per acquisition (CPA) and a high return on ad spend (ROAS). On the flip side, identify campaigns that are overspending without delivering conversions or those with a CPA significantly higher than your account's average. These should be flagged for a closer look.
It’s essential to dig deeper into the details. Sometimes, an underperforming ad group or ad set can drag down the results of an otherwise solid campaign. For example, within the same campaign, one ad group might have a CPA of $18 while another has a CPA of $55. This discrepancy might go unnoticed unless you examine the data at a granular level. Once you find the weak link, you can pause it or shift its budget to better-performing segments.
To avoid emotional decision-making, establish clear thresholds for pausing campaigns ahead of time. For instance, you might decide to pause any ad that spends over $100 without generating a conversion or any ad set with a ROAS below break-even levels for 14 consecutive days. These measures ensure that every campaign you run is driving business growth.
"Facebook ads reporting is not a scoreboard. It's a diagnostic instrument. Build it to produce decisions, not documentation." - AdStellar
After addressing underperformers, turn your attention to audience and location data to refine your targeting.
For businesses like home service providers, geographic data can be a game-changer. Reports like "Distribution by Location" can reveal ZIP codes or cities where your cost per lead is lowest and conversions are strongest. Once you identify these high-performing areas, allocate more of your budget to them.
Device data is just as critical. If mobile devices account for 70% of your clicks but only 20% of your conversions, the issue might not lie with your ad but with your mobile landing page. Problems like slow load times or overly complex forms can derail conversions before they happen. Fix these issues and reassess your performance. Combining these insights with your overall campaign strategies ensures a consistent, data-driven approach across all platforms.
Building on your performance analysis, refine your ad creative and offers by focusing on key metrics. Think of creative performance as a chain: CPM → Hook Rate/CTR → Conversion Rate (CVR). For example, if CPM is steady but your click-through rate (CTR) is low, your creative or offer might need an overhaul. On the other hand, if CTR is strong but conversions are lacking, there could be a disconnect between your ad and the landing page. Each weak link in this chain points to a specific area for improvement.
For Meta ads, keep an eye on frequency. Creative fatigue often sets in when frequency rises above 3.0 for cold audiences and 6.0 for retargeting audiences. You’ll know it’s happening when you see frequency climbing, CTR dropping, and CPM increasing. When this occurs, it’s time to introduce fresh creative rather than simply boosting your budget.
Home service providers can benefit from running three distinct creative angles at all times: proof-and-reviews (like customer testimonials), problem-and-relief (educational content), and offer-driven messages (promotions or guarantees). Rotating these angles helps prevent burnout and provides varied data points for analysis.
The table below can help you diagnose common performance issues and decide your next steps:
| Diagnostic Scenario | Primary Signal | Likely Issue | Recommended Action |
|---|---|---|---|
| Low Hook Rate & Low CTR | Stable CPM | Weak creative or offer | Refresh visuals; add local signals like city names |
| Good CTR but Poor CVR | High bounce rate | Landing page friction | Improve load speed; simplify forms |
| Rising CPM & Frequency | Falling CTR | Creative fatigue | Rotate in fresh testimonials or job footage |
| High Spend, No Results | Poor ROAS | Targeting or offer mismatch | Pause campaign or reallocate budget |
Transforming data into business growth isn't just about crunching numbers - it's about using those numbers to make smarter decisions. From setting clear goals to creating dashboards tailored to your needs, every step in this guide is aimed at turning insights into tangible results. Without solid reporting, platforms like Google and Facebook ads can feel like shooting in the dark.
Consider this: missing attribution tracking wastes an estimated 30–40% of marketing budgets. On the flip side, companies that track ROI by channel see their revenue grow by an average of 3.2x. That’s the gap where businesses can gain a real edge.
"The contractor who tracks every lead back to its source will outgrow the one who spends twice as much but can't tell you where the money goes." - Digital Footprint Solutions
This highlights why data-driven strategies are no longer optional - they’re essential. Estatehub is a game-changer for home service providers. Instead of just handing over a dashboard and stepping away, Estatehub takes a more hands-on approach. They combine detailed reporting with ongoing campaign management, ensuring ad spend translates into booked revenue. Plus, they guide providers on converting leads into actual customers. The results? Korbin Reitz saw his bookings explode from 1–2 jobs per month to nearly 20 jobs per month in just 45 days after launching a managed campaign with Estatehub.
Precise tracking and optimized dashboards are the backbone of performance. With robust reporting, you can identify your next strategic move - whether it’s reallocating budgets or tweaking ad copy. Start with clean data tracking, build dashboards that align with your goals, and let those insights guide every decision you make.
To measure your cost per booked job effectively, prioritize tracking actions that indicate strong intent, such as phone calls lasting over 60 seconds, form submissions that lead to thank-you pages, and confirmed bookings.
Leverage a combination of browser-based tracking and server-side tools like the Meta Conversions API to navigate around privacy filters that may block data. Regular audits of your conversions against your CRM are essential to maintain accuracy. Additionally, use event deduplication IDs to prevent double-counting of conversions.
To avoid double-counting conversions, use a neutral and reliable source like Google Analytics 4 (GA4) or your CRM. GA4 provides a clear picture of the entire user journey by assigning a single source to each session.
For Google Ads, make sure to link your conversion actions to GA4. This helps ensure consistent data and avoids discrepancies. When working with Meta, set up your pixel and Conversions API with matching event IDs to keep tracking accurate.
It's also a good idea to regularly cross-check the data reported by platforms with your CRM's sales records. This will help you spot and correct any inflated numbers.
The text doesn't explain how the Meta Conversions API works alongside the Meta Pixel. Estatehub specializes in assisting home service providers in tracking conversions and managing customer relationships using CRM tools and strategies aimed at boosting revenue. For precise technical guidance on setting up Meta tracking, refer to Meta’s official documentation or consult a qualified professional.
Sign up for the newsletter and be the first to read our articles.


Every single person on our agency team has spent a lot of time in the field either running their own business or working for larger marketing agencies. We have all put in the time responding to leads, helping customers, scheduling and doing services. This gives us a massive advantage when making decisions.
One thing that has always been very special to us, is the fact that (excluding spam / people that never used our services) we do not have any bad reviews. This absolutely does not mean we have never had unhappy clients, but if it happens, we make it right, and stand behind our promises.
We have seen, time and time again, other agencies using strategies and structuring campaigns the way that they are technically supposed to. Most of these "best practices" that are taught in our industry, simply do not transfer into local lead gen. This is partially because we do have a much different target audience, and are typically spending less, however optimizing for website traffic does not work here.
We have been there, jumping into starting a home service business, struggling, and doing everything wrong. It's humbling. Our team has all felt the highs and lows, which is why we get so excited for our clients to win, we know how good it feels.

Estatehub is not a normal agency, we know "clicks" don't get you sales. Let us show you how lead gen experts do it.

