


Overview of Common Stains
Full overview of the most common stains, including how to identify them and treat them
Content performance tracking helps you measure how well your marketing efforts drive results. For home service businesses, this means using data to evaluate blogs, service pages, and landing pages to see what generates leads and conversions. Without tracking, you're guessing - and wasting time and money on ineffective strategies.
Key takeaways:
Tracking ensures you invest in strategies that convert visitors into customers. Start by setting measurable goals, analyzing traffic sources, improving engagement, and optimizing for conversions. Use tools to connect user behavior to revenue and refine your content for better performance.
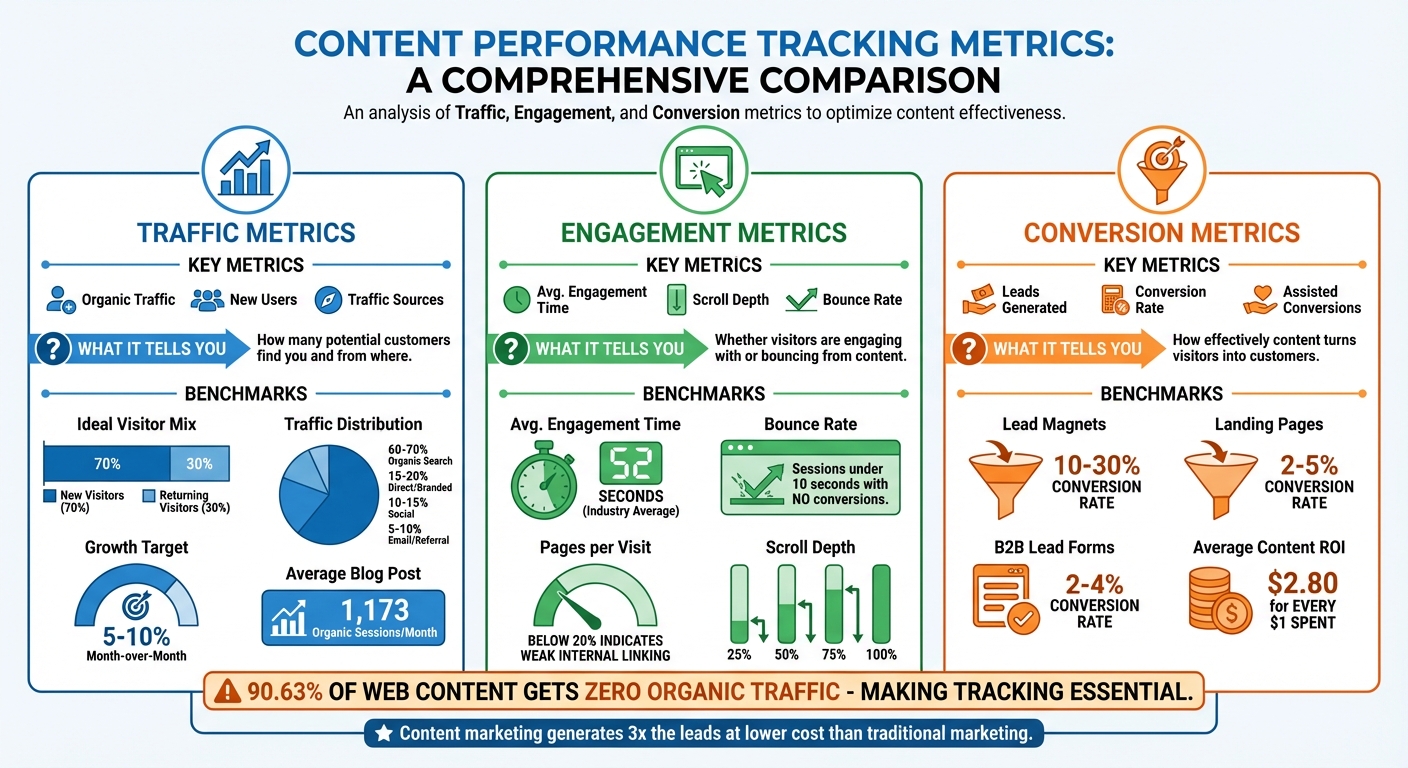
Content Performance Tracking Metrics: Traffic, Engagement, and Conversion Benchmarks
When it comes to measuring the success of your content strategy, focus on three key areas: traffic, engagement, and conversions. Each provides valuable insights into how your content performs and connects with your audience.
Traffic metrics help you understand how many people are visiting your site and where they’re coming from. Organic traffic, which refers to visitors arriving through unpaid search results, is a critical indicator of your SEO performance. For instance, if someone searches "emergency plumber near me" and lands on your service page, that’s organic traffic in action. Tools like Google Analytics 4 (GA4) let you track both Users (unique visitors) and Sessions (total visits), helping you see whether you're attracting new audiences or retaining existing ones.
New Users are a key metric for growth, showing how well your content is expanding your customer base. A healthy content program typically aims for about 70% new visitors and 30% returning visitors. Traffic sources also reveal where your audience originates, such as:
For most home service businesses, a good distribution might look like 60-70% organic search, 15-20% direct/branded traffic, 10-15% social, and 5-10% email or referral traffic.
Google Search Console provides additional insights with Impressions (how often your content appears in search results) and Clicks (how many people actually visit). For example, if your "water heater installation" page gets 5,000 impressions but only 50 clicks, it might be time to improve your title or meta description. Tracking keyword rankings is also essential - knowing you rank #3 for "HVAC repair [your city]" gives you a clear target to aim for.
Established content programs often aim for an organic traffic growth rate of 5-10% month-over-month. As a benchmark, the average blog post attracts 1,173 organic sessions per month. If your numbers fall short, consider revisiting your topics or refining your SEO strategy.
Once you’ve analyzed traffic, shift your focus to how users engage with your content.
Traffic shows how many people visit your site, but engagement metrics reveal how interested they are in your content. In GA4, Average Engagement Time measures how long users actively interact with your website (excluding background tabs). For context, the average across industries is 52 seconds. If your "seasonal HVAC maintenance tips" page averages 2 minutes, it’s clear your audience finds it useful.
Another critical metric is Bounce Rate, which in GA4 tracks the percentage of sessions lasting under 10 seconds with no conversions or fewer than two page views. A high bounce rate may signal that your content doesn’t align with visitors’ expectations. For instance, if someone searching for "emergency AC repair" lands on a generic homepage instead of a dedicated service page, they’ll likely leave quickly.
Scroll Depth measures how far down the page users scroll (e.g., 25%, 50%, 75%, or 100%). If most visitors drop off at 50%, your call-to-action (CTA) might be buried too far down. Similarly, Pages Per Visit indicates how many additional pages users view after landing on your site. A low rate - below 20% - suggests weak internal linking. For example, if someone reads your "signs you need a new roof" blog but doesn’t click through to your roofing services page, you’re missing an opportunity.
Visual tools like Hotjar or Microsoft Clarity offer heatmaps that show where users click and where they stop scrolling. These tools complement your quantitative data by identifying friction points that might otherwise go unnoticed.
After evaluating engagement, it’s time to measure how effectively your content drives business results.
Conversions represent the ultimate goal: turning visitors into customers. These could include form submissions, demo requests, newsletter signups, or phone calls. If your blog on seasonal HVAC maintenance attracts 2,000 visitors but generates no service inquiries, something’s off - either your content doesn’t match user intent, or your CTAs aren’t clear enough.
Leads Generated is a primary indicator of content ROI. GA4 allows you to set up Key Events (formerly conversions) for actions like "Book an Appointment" or "Call Now". This way, you can track which pieces of content directly drive business. Don’t overlook Assisted Conversions, which measure content that plays a supporting role in the customer journey. For example, an educational guide might not generate direct leads but could consistently influence potential customers.
Here’s a quick breakdown of key metrics and what they tell you:
| Metric Type | Key Metrics | What It Tells You |
|---|---|---|
| Traffic | Organic Traffic, New Users, Sources | How many potential customers find you and from where |
| Engagement | Avg. Engagement Time, Scroll Depth | Whether visitors are engaging with or bouncing from content |
| Conversion | Leads, Conversion Rate, Assisted Conversions | How effectively content turns visitors into customers |
For home service providers, typical benchmarks include:
If your numbers fall below these ranges, experiment with different CTAs, simplify your forms, or refine your offers. To calculate Content ROI, compare the revenue generated from content to its production costs. For example, if you spent $500 creating a guide that brought in $5,000 in new business, that’s a 900% ROI - a clear win.
For home service businesses, conversion metrics are the clearest measure of how well your content drives inquiries and leads.
KPIs keep us accountable, provide the client with transparency into what work we deliver, and, most importantly, demonstrate that we are on track and achieving mutually agreed-upon goals. - David Krauter, SEO Strategist, Websites That Sell
When it comes to content performance, the right tools can turn raw data into actionable insights that drive revenue. While there are countless options available, three core categories stand out: analytics platforms to track user behavior, CRM systems to connect activity to revenue, and heatmap tools to visualize user interaction. Together, these tools provide the metrics needed to refine and strengthen your content strategy.
Google Analytics 4 (GA4) is an essential tool for understanding how users engage with your website. It tracks key metrics like page views, engagement rate, and average engagement time - helping you gauge the effectiveness of your content. Since officially replacing Universal Analytics on July 1, 2023, GA4 has introduced a more advanced tracking system. For instance, an "engaged session" in GA4 is defined as one lasting over 10 seconds, involving a conversion event, or including at least two page views.
Google Search Console (GSC) works hand-in-hand with GA4 by offering insights into how users find your site through search engines. It tracks metrics like average ranking position, impressions, clicks, and click-through rates for specific keywords. When you link GSC with GA4, you get a comprehensive view of your content’s journey - from the search query that brings users to your site to the actions they take once they arrive.
For added precision, Google Tag Manager (GTM) allows you to track detailed scroll metrics, such as 25%, 50%, 75%, and 100%, which go beyond GA4's default 90% trigger. Both GA4 and GSC are free, making them accessible tools for businesses of all sizes.
"Content without data is like a property without a foundation - it lacks stability. Without data, you can't truly understand the impact of your content and what to do next." - Abby Webb, Head of Search & Content, Base Creative
With these analytics tools in place, the next step is tying user behavior to revenue through CRM platforms.
While analytics tools provide insights into user behavior, CRM platforms connect that behavior to revenue. For industries like home services, this connection is crucial. A good CRM can track how specific blog posts or service pages contribute to lead generation, even when conversions happen over multiple visits. This multi-touch attribution helps reveal the full value of your content.
Estatehub is one example of a platform that integrates content tracking with lead management and campaign optimization. It’s designed to go beyond clicks, focusing on how content drives actual sales.
"Estatehub is not a normal agency, we know 'clicks' don't get you sales. Let us show you how lead gen experts do it." - Estatehub
By syncing your CRM with GA4, you can identify which articles or pages drive form submissions, calls, or bookings - giving you a clearer picture of your content’s ROI.
While CRM platforms focus on numbers, heatmaps provide a more visual way to understand user interactions.
Heatmaps give you a visual representation of user activity, such as clicks, scroll depth, and drop-offs. For example, if analytics show that visitors are leaving your "request a quote" page without converting, a heatmap can reveal whether users are missing the form because they’re not scrolling far enough or are interacting with elements that aren’t functional.
Microsoft Clarity is a completely free tool, while Hotjar offers a free tier with paid plans starting at $32–$99 per month. Both platforms include session recordings, allowing you to watch real visitor interactions. For instance, repeated clicks on a non-clickable phone number might highlight a need to improve your site’s mobile usability.
Heatmaps are especially useful on high-value pages like service landing pages or lead magnets. For example, if scroll depth data shows visitors dropping off before reaching a key call-to-action - such as a "Book Now" button placed too low on the page - you can reposition it for better visibility.
"A combination of benchmarking and careful measurement is the secret to knowing which strategies and tactics work, and when you need to pivot." - Brie Anderson, Founder, BEAST Analytics
Data becomes powerful when it leads to actionable changes. For home service providers, this could mean identifying which pages effectively generate leads, spotting gaps where customer questions go unanswered, and adjusting your messaging based on visitor behavior.
Leverage GA4 to distinguish between pages that attract high traffic and those that genuinely engage users. For instance, a blog post might get plenty of views but underperform if its average engagement time is below the industry standard of 52 seconds or if its conversion rates fall short (e.g., case studies typically aim for 2-5%, while video tutorials often target 40-60% completion rates).
Use GA4’s "Page path and screen class" filter to focus on specific sections, like "/services/" or "/blog/", to understand which categories resonate most with your audience. Pair this with Google Search Console to uncover the keywords driving clicks. For example, if a guide ranks well for a query popular in your area, it might be worth expanding on that topic. Additionally, tracking scroll depth through Google Tag Manager (e.g., at 25%, 50%, 75%, and 100% intervals) can reveal where users drop off, helping you refine call-to-action placement or content flow.
Once you’ve identified your top-performing content, it’s time to address areas where your audience’s needs aren’t being met.
Pages with high impressions but low click-through rates often signal that title tags or meta descriptions don’t align with user intent. Check your internal search data to uncover what visitors are looking for but not finding. For example, if users frequently search for detailed service cost information but only find installation guides, you’ve uncovered a clear gap.
Refreshing outdated content can also work wonders. In one case, a thorough content refresh led to an 81% increase in organic traffic and more than doubled lead generation in just 30 days. Mapping your content to the buyer’s journey - Awareness, Consideration, and Decision - can further highlight areas needing more depth, such as pricing guides or detailed case studies.
Once gaps are addressed, personalizing content based on user behavior can take your strategy to the next level.
Segment your audience to create tailored strategies. For example, use GA4 to differentiate between new and returning visitors. If a page gets plenty of views but has a low share of new users, it might appeal to loyal customers but fail to attract fresh leads.
Device-specific engagement is another key area. If mobile users show lower engagement than desktop users, consider optimizing your mobile layout with shorter paragraphs, larger buttons, and faster load times.
A great example of personalization comes from a B2B software company in 2025. Using cohort analysis in GA4, they discovered that visitors who initially engaged with "how-to" guides were 2.8x more likely to return weekly than those who entered via list posts. Based on this, they allocated 40% of their content calendar to instructional guides, boosting their return visitor rate by 35%.
You can also set up custom dimensions in GA4 - such as "Content Topic", "Content Format", and "Content Stage" - and combine them with heatmaps to identify what drives engagement and conversions. For home service providers using platforms like Estatehub, integrating behavioral data with CRM lead tracking can offer deeper insights into which content not only engages visitors but also leads to actual bookings.
Tracking content performance is a must for effective marketing in the home services industry. With most online content failing to attract organic traffic and less than half of marketers effectively measuring performance, tracking becomes the key to standing out. By focusing on metrics like engagement, visibility, and conversions, you can make smarter decisions about where to invest your time and budget, ultimately driving business growth.
Content marketing delivers impressive results, generating three times the leads at a lower cost compared to traditional marketing methods. Plus, by optimizing underperforming content instead of creating new material, you can achieve 106% more leads. The average return on investment for content marketing is $2.80 for every $1 spent, but you'll only know if you're meeting or exceeding this benchmark if you're tracking the right data.
Keep in mind, tracking isn’t a one-and-done task. Audiences change, search algorithms shift, and new tools - like AI-driven search platforms - transform how people find information. What worked six months ago might not work today, so regular monitoring and adjustments are essential.
These insights naturally lay the groundwork for refining your content strategy. With the benefits clearly outlined, it’s time to take actionable steps.
Start by setting measurable goals that align with your business priorities. For example, aim to increase organic leads by 10% in the next quarter or improve conversion rates on specific service pages. Use tools like GA4 and Search Console to track your progress, as mentioned earlier. Configure custom events to measure key actions like form submissions or phone calls.
Before making decisions, collect at least three months of baseline data. This will give you a clear picture of your current performance. Apply UTM parameters to all your marketing links to identify which channels are driving the most valuable traffic. Review your data monthly: if you notice high traffic with low engagement, refine your content to align better with search intent. If engagement is strong but conversions are lacking, focus on improving your calls-to-action.
For home service providers using platforms like Estatehub, integrating your CRM with analytics tools can help you identify which content drives conversions. Start small by focusing on metrics that offer quick wins, then expand as you see results. As Moz wisely says:
"If you can measure something, you can improve it".
To get the most out of Google Analytics 4 (GA4) for tracking your content's performance, tap into its event-based tracking system. This approach goes beyond simple metrics like page views, helping you monitor key user interactions such as scroll depth, time spent on a page, and conversions. These engagement signals give you a clearer picture of how users are engaging with your content.
For more precise tracking, set up custom events with tools like Google Tag Manager. This allows you to capture specific actions, like video plays or button clicks, that matter to your goals. Additionally, take advantage of content grouping and exploration reports to dig into trends, spot your top-performing pages, and pinpoint areas that could use improvement. With these insights, you can fine-tune your content strategy and achieve stronger results for your business.
To tackle low engagement and conversion rates, start by diving into key metrics such as traffic patterns, engagement levels, and conversion data. These numbers reveal what’s clicking with your audience - and what’s not. By identifying trends, you can fine-tune your approach and focus on delivering content that truly connects with your readers.
Make it a habit to regularly assess your content’s performance. Use tools like Google Analytics to track your progress and set clear, actionable goals. From there, refine your strategies by optimizing keywords, improving on-page SEO, and building on content topics that have already shown success. With consistent monitoring and smart adjustments, you can steadily boost both engagement and conversions.
To tackle content gaps effectively, start by reviewing how your current content is performing. Pay close attention to metrics like user engagement, conversion rates, and bounce rates. These numbers can reveal which topics your audience connects with and which ones might be falling flat. Conducting a content audit is a great way to spot outdated material or subjects you haven’t covered yet.
After identifying the gaps, establish clear goals that align with your business priorities. Tools like Google Analytics can help you monitor traffic and engagement, making it easier to identify where your content is missing the mark. Fill these gaps by creating new, targeted content or refreshing older pieces to make them more relevant and engaging. Using this approach keeps your content strategy focused and ensures it delivers value to your audience.
Sign up for the newsletter and be the first to read our articles.


Every single person on our agency team has spent a lot of time in the field either running their own business or working for larger marketing agencies. We have all put in the time responding to leads, helping customers, scheduling and doing services. This gives us a massive advantage when making decisions.
One thing that has always been very special to us, is the fact that (excluding spam / people that never used our services) we do not have any bad reviews. This absolutely does not mean we have never had unhappy clients, but if it happens, we make it right, and stand behind our promises.
We have seen, time and time again, other agencies using strategies and structuring campaigns the way that they are technically supposed to. Most of these "best practices" that are taught in our industry, simply do not transfer into local lead gen. This is partially because we do have a much different target audience, and are typically spending less, however optimizing for website traffic does not work here.
We have been there, jumping into starting a home service business, struggling, and doing everything wrong. It's humbling. Our team has all felt the highs and lows, which is why we get so excited for our clients to win, we know how good it feels.

Estatehub is not a normal agency, we know "clicks" don't get you sales. Let us show you how lead gen experts do it.

