
If your moving company needs leads now, Google Ads usually wins first. If your goal is lower cost per booked move over time, SEO tends to win later.
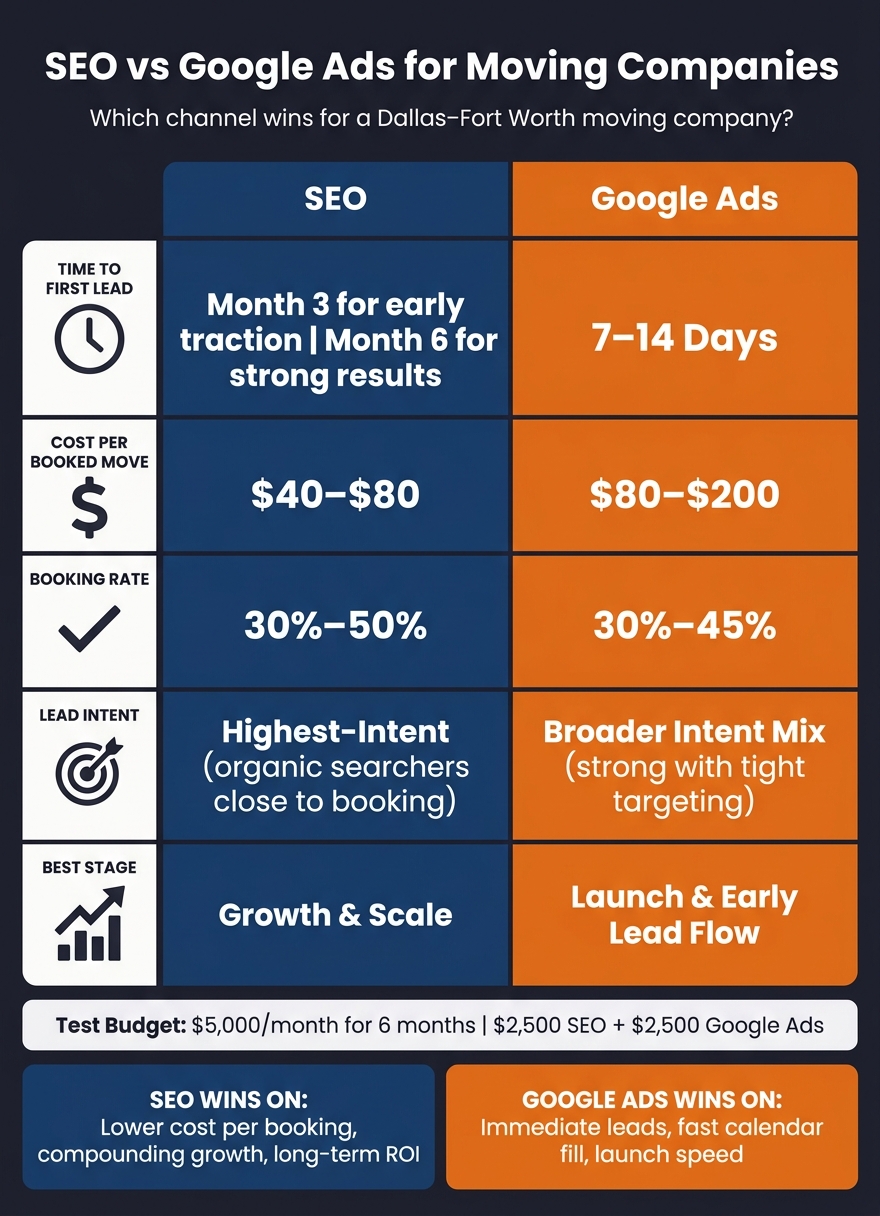
For this Dallas–Fort Worth moving company, Google Ads started producing leads in 7–14 days. SEO took longer, with stronger lead flow showing up around Month 3 and building more by Month 6. During the test, SEO landed at about $40–$80 per booked job, while Google Ads came in around $80–$200 per booked job.
Here’s the short answer:
- Google Ads worked best for launch and filling the calendar fast
- SEO worked best for growth and lower long-term acquisition cost
- The company started at 50 leads/month, 22 booked moves/month, and about $29,700/month in baseline revenue
- The test budget was $5,000 per month for 6 months
- The five factors compared were cost per lead, time to first lead, lead quality, booking rate, and growth-stage fit
This means your best channel depends on when you need results, not just which one brings clicks. Ads help first. SEO helps more as time goes on.
Quick Comparison
| Factor | SEO | Google Ads |
|---|---|---|
| Time to first lead | Around Month 3 for clear traction | About 7–14 days |
| Cost per booked move | $40–$80 | $80–$200 |
| Lead quality | Often high-intent | Mixed, but still strong with tight targeting |
| Booking rate | 30%–50% | 30%–45% |
| Best stage | Growth and scale | Launch and early lead flow |
If you’re comparing SEO vs. Google Ads for a moving company, this case study points to a simple pattern: use Google Ads for small businesses for fast demand, and use SEO to cut cost per booking over time.
SEO vs Google Ads for Moving Companies: Cost, Speed & ROI Compared
How Fast Will You See Results With Google Ads and SEO?
sbb-itb-2aa0348
Case Setup: Company Profile, Budget, and Starting Point
This case study looks at a realistic mid-sized U.S. moving company. The setup is based on a company in the Dallas–Fort Worth metro area, so the takeaways should feel familiar to many moving business owners.
Company Snapshot and Starting Numbers
The company serves the greater Dallas–Fort Worth area and runs 5 trucks, with 2–3 movers per crew. Its main focus is local residential moves. It also handles apartment moves and small office relocations. Most jobs fall within a 25- to 50-mile range and target middle-income households and apartment renters.
At the start, the company was bringing in about 50 leads per month. Most of those came from:
- Word-of-mouth referrals
- A Google Business Profile with about 30 reviews
- A basic website with no planned SEO work or set Google Ads system
Out of those 50 leads, about 22 turned into booked moves each month. That puts the booking rate at roughly 44%. With an average job value of $1,350, monthly baseline revenue came to about $29,700.
The company could handle up to 40 jobs per month, so there was still plenty of room to add more booked moves before hitting capacity. Put simply, the trucks weren't maxed out yet.
The test budget was $5,000 per month for 6 months:
- $2,500 for SEO
- $2,500 for Google Ads made up of $2,000 in ad spend and $500 in management
| Starting Metric | Baseline Figure |
|---|---|
| Monthly leads | 50 leads/month |
| Monthly booked moves | 22 jobs/month |
| Average job value | $1,350 |
| Monthly revenue baseline | $29,700 |
| Max monthly capacity | 40 jobs/month |
| Monthly marketing budget | $5,000 total |
These figures give us the starting line for the channel comparison.
How Results Are Measured in This Case Study
To track performance, the case study uses three inputs: a dedicated phone number for each channel, UTM-tagged quote forms, and a CRM that records each lead source at the time of inquiry.
The main comparison formula is simple:
total channel spend ÷ booked jobs from that channel = cost per booked move
That number, along with the revenue each channel brings in, is what the later sections use to compare SEO and Google Ads.
With the baseline in place, the next sections look at how SEO and Google Ads stack up on speed, cost, lead quality, and bookings.
SEO Results for the Moving Company
SEO started slowly, then became the stronger channel over time. For this moving company, the first three months were mostly about getting the groundwork in place: technical fixes, service-area pages, and Google Business Profile (GBP) work to improve local pack visibility. So early lead volume was weak, but local visibility improved as the campaign picked up steam.
Speed, Cost, and Lead Quality From SEO
GBP updates - service categories, job photos, and review replies - began to improve local visibility within 4 to 8 weeks and started bringing in local calls by Month 3.
That timing matters. SEO often brings in people who are closer to booking, and phone leads from local SEO convert at a 46% rate, compared with 12–15% for digital form fills. In plain English: people who call are often more ready to hire.
Industry CPL averaged $90.92 in 2025, which is why cost per booked job is the better way to judge SEO here. By Month 6, organic traffic was starting to build, and cost per booked job was moving into the $40–$80 range once the campaign had time to mature.
Booking Rate and Long-Term Growth From SEO
Once SEO started working, the booking rate from SEO-generated leads stayed in the 30–50% range. Strong reviews and exclusive organic leads helped support that close rate. The result was simple: better inquiries, with a better chance of turning into booked jobs.
| Timeline | Investment | Leads | Cost Per Lead | Booking Rate | Revenue Impact |
|---|---|---|---|---|---|
| Month 1 | Setup-heavy | Very low | N/A | N/A | Little lead volume; focus on technical SEO |
| Month 3 | Consistent | Low to moderate | High | 30–50% | GBP driving local calls |
| Month 6 | Consistent | Moderate | Decreasing | 30–50% | SEO covered more of the marketing cost |
| Month 12 | Consistent | Strong | 40–60% lower | 30–50% | SEO generates 50%+ of leads organically |
By Month 12, SEO cost per lead had dropped by 40%–60%, while rankings, authority, and reviews kept bringing in leads even with less active spend.
Next, Google Ads shows the opposite pattern: faster leads, higher early spend, and less compounding over time.
Google Ads Results for the Moving Company
Google Ads started producing leads almost right away. Within 7 to 14 days of launch, the campaign was bringing in leads from people actively looking for moving services in the target area. That kind of speed mattered most at the start, when organic search still needed time to build. For this moving company, Google Ads covered that gap while SEO was still getting off the ground.
Speed, Cost, and Lead Quality From Google Ads
The campaign centered on exact-match, high-intent local keywords to reach searchers who were closest to booking. The traffic alone wasn’t enough, though. Trust-focused landing pages, paired with AI-powered follow-up, played a big part in getting more out of each click.
Google Ads leads usually came in at $100 to $350 per booked job. If the main goal is fast lead flow, paid search can make a lot of sense.
Booking Rate and Early-Stage Growth From Google Ads
In the launch phase and early growth period, Google Ads produced the first lead flow the business could use. For home service providers, Google Ads campaigns usually close at 30% to 45%, and speed-to-lead is the main reason why.
"Responding within 60 seconds vs 2 hours is the single biggest close rate lever." - Ryan Goering, CEO & Founder, BaaDigi
Responding within 60 seconds had the biggest impact on close rate. That puts the tradeoff in plain view: Google Ads brought speed first, while SEO worked in the background toward lower-cost growth.
SEO vs Google Ads: Which Channel Worked Best at Each Stage
Google Ads won at launch. SEO won on efficiency and scale.
Once both channels were tracked, the main question changed: which one drives booked moves first, and which one gets better over time?
Side-by-Side Comparison: Cost, Speed, Quality, and Booking Rate
The table below shows the differences that mattered most in this case.
| Metric | SEO | Google Ads |
|---|---|---|
| Cost Per Booked Job | $40–$80 during the 6-month test period | $80–$200 during the 6-month test period |
| Speed to First Lead | Slow: meaningful leads usually start by month 3, with stronger results by months 6–12 | Immediate |
| Lead Intent | Highest-intent | Broader intent mix |
| Booking Rate | 30%–50% on organic leads | 30%–45% with fast follow-up |
| Best Use Case | Growth and scale | Launch and immediate volume |
SEO pulls ahead after the ramp-up period because it cuts the cost per booked job.
Conclusion: Best Channel by Launch, Growth, and Scale
At launch, Google Ads is the practical pick. It fills the calendar while SEO is still starting up. During growth and scale, SEO becomes the lower-cost channel.
In this case study, Google Ads won on speed at launch. SEO won on lower cost per booked job and staying power over time. Estatehub uses this sequence to tie ads, SEO, and CRM data back to booked revenue.
Launch leans toward Google Ads. Growth leans toward SEO.
FAQs
Should I run SEO and Google Ads at the same time?
Yes. Running SEO and Google Ads together can help home service businesses get fast leads from paid search while building long-term growth through SEO.
Google Ads puts you in front of people NOW, which is useful for seasonal demand spikes or time-sensitive offers. SEO does the slower, steady work of building authority and can bring down your cost per lead over time.
Estatehub also uses paid campaign data to sharpen SEO efforts and put budget behind the jobs that lead to bookings and revenue.
How long should I wait before judging SEO results?
SEO is a long-term investment. Most businesses start seeing meaningful movement in 3 to 6 months. The biggest gains - and a steadier flow of leads - often show up in 6 to 12 months.
That said, you might notice early signals within a few weeks, like better keyword rankings or more local visibility. Check performance each month so you can track long-term ROI as your organic presence builds.
What affects cost per booked move most?
Cost per booked move mostly comes down to two numbers: your cost per lead (CPL) and your lead-to-booked-job conversion rate.
CPL tells you what you pay to get someone interested. But that number alone doesn't tell the full story. To see what it costs to land a customer, divide your CPL by your conversion rate.
Here’s the idea in plain English: if your CPL is $50 and 20% of leads turn into booked jobs, your cost per booked move is $250.
Location and follow-up speed matter too. In competitive urban markets, costs can climb by 50% to 100%. And speed matters more than most teams think. Leads contacted within five minutes are much more likely to convert.
Related Blog Posts

Sign up for the newsletter and be the first to read our articles.