

Overview of Common Stains
Full overview of the most common stains, including how to identify them and treat them
Most U.S. home service businesses in 2026 need at least $1,500 to $3,000 per month on Facebook to drive steady lead flow, while CPL often lands between $62 and $280 depending on the trade.
If your numbers look off, this article gives you a simple baseline. You’ll see what small, growing, and multi-crew contractors tend to spend, what lead costs look like for trades like HVAC, plumbing, roofing, remodeling, landscaping, and fencing, and how seasonality changes budget efficiency.
Here’s the short version:
| Area | 2026 Benchmark |
|---|---|
| Average home services CPL | $66 |
| Small/solo budget | $500–$1,000/month |
| Growing budget | $1,500–$3,000/month |
| Established budget | $3,000–$8,000+/month |
| HVAC CPL | $92–$300 |
| Plumbing CPL | $20–$167 |
| Roofing CPL | $150–$350 |
| Remodeling/Construction CPL | $200–$450 |
| Landscaping CPL | $20–$175 |
| Fencing CPL | $40–$85 |
The main takeaway: you should judge Facebook spend by cost per booked job, not just cheap leads, because a high CPL can still make sense when job value and close rate are strong.
These 2026 spend ranges help you see if your Facebook budget is too lean, in a good spot, or ready to grow. The monthly ranges below assume a blended CPL of about $65.
Not every contractor should spend the same amount. A solo operator doesn't need the same budget as a multi-crew HVAC company. The table below shows monthly ranges that make sense and the lead volume that usually comes with them.
| Contractor Size | Monthly Budget Range | Approx. Monthly Lead Volume | Primary Goal |
|---|---|---|---|
| Small / Solo | $500 – $1,000 | 7 – 15 leads | Testing and light visibility |
| Growing / Single-Location | $1,500 – $3,000 | 22 – 45 leads | Weekly lead flow |
| Established / Multi-Crew | $3,000 – $8,000+ | 45 – 120+ leads | Multi-crew volume |
Think of $500–$1,000 as a testing floor, not a budget that will keep your calendar packed.
The $1,500–$3,000 range is where many single-location contractors start to hit a steady rhythm. At that level, you can bring in enough leads each month to keep a small team moving.
If you're running multiple crews or covering more than one service area, $3,000–$8,000+ is usually what it takes to keep job volume up.
A lot of home service accounts in 2026 use a "lead-first" allocation model. Put simply, the budget is built around lead flow, retargeting, and seasonal demand based on how much each piece drives revenue.
Most of the budget - about 70–80% - goes to direct lead-gen campaigns that use on-Facebook lead forms. Homeowners can send their info without leaving the app, which cuts friction and makes it easier to collect leads.
Another 10–15% usually goes to retargeting. This tends to matter more for higher-ticket jobs like remodeling or HVAC replacement, where the sales cycle can run from three to eight weeks.
The last 5–10% often goes to awareness and seasonal campaigns. Think HVAC tune-up reminders before summer or a spring landscaping promo.
Budget should track job capacity and service priority, not some fixed share of revenue. Next, CPL benchmarks show which trades make that budget go farther.
2026 Facebook Ad Benchmarks for Home Services by Trade
Monthly ad spend only makes sense if your cost per lead lines up with your close rate and the value of the jobs you win.
In home services, CPLs tend to run higher than broad ad platform averages. That's because these jobs are local, competitive, and often worth a lot of money. So instead of asking, "Is this lead cheap?" the better question is: Can this lead turn into profit?
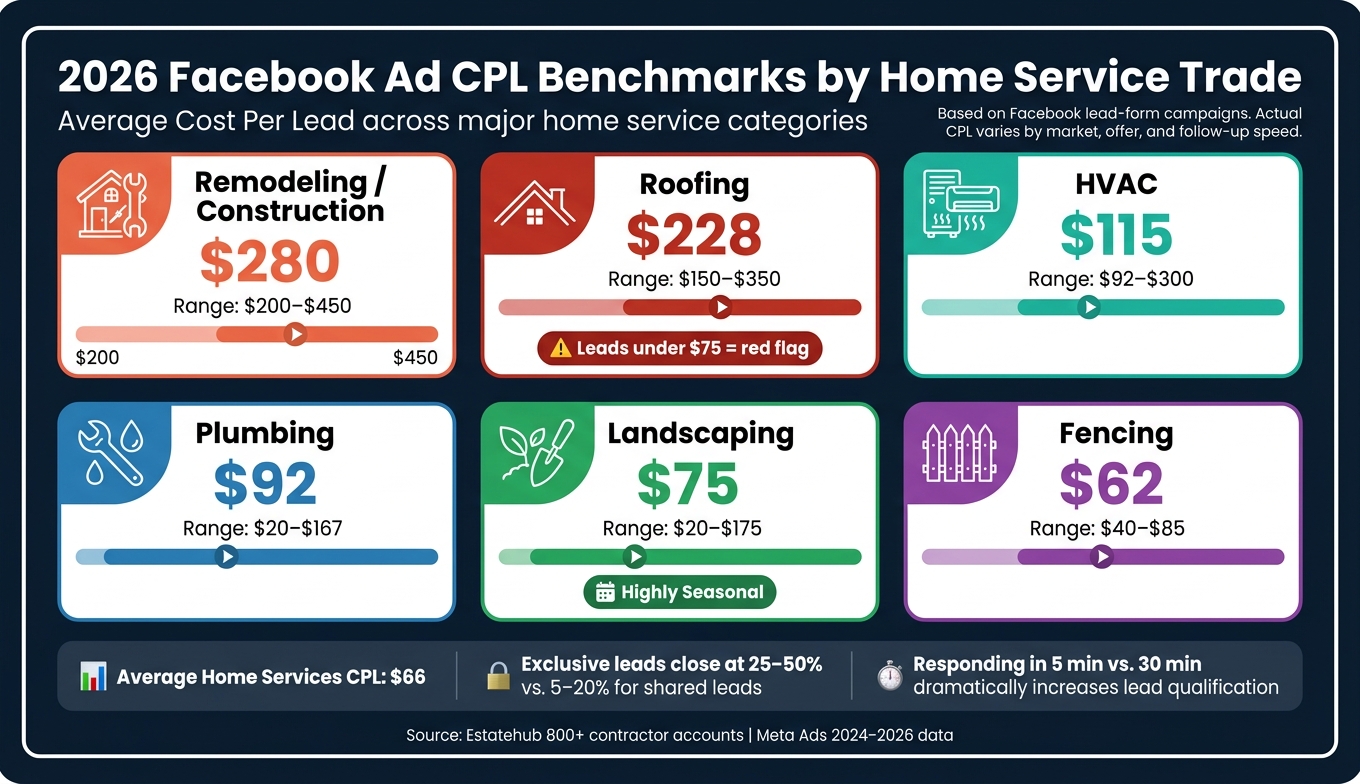
Here are the average CPL ranges to use as a gut check for each trade:
| Trade | Average CPL | Typical Range | Notes |
|---|---|---|---|
| HVAC | $115 | $92 – $300 | Higher costs for full system replacements |
| Plumbing | $92 | $20 – $167 | Wide range due to repair vs. install; Meta Ads average $72.97 |
| Roofing | $228 | $150 – $350 | High intent; leads below $75 are red flags |
| Remodeling / Construction | $280 | $200 – $450 | Highest CPL due to large job values |
| Landscaping | $75 | $20 – $175 | Highly seasonal; hardscaping skews higher |
| Fencing | $62 | $40 – $85 | Moderate purchase intent; visual ads perform well |
Roofing is a good example of why context matters. If your roofing CPL is under $75, that usually isn't a win. In crowded markets, leads that cheap are often shared, weak, or both.
Seasonality can swing CPL a lot. The same service may cost far more in one part of the year and far less in another, even with the same market and the same offer.
| Service Type | Season | Typical CPL Pattern |
|---|---|---|
| HVAC | Summer / Winter | Peak demand; highest CPL, but strong conversion on repairs and installs |
| Roofing | Post-Storm / Fall | CPL spikes after weather events; high intent for insurance-backed jobs |
| Landscaping | Spring / Summer | Peak demand; CPL ranges $75 – $175 |
| Landscaping | Winter | Most efficient; CPL drops to $20 – $50; ideal for booking spring projects |
| Plumbing | Year-Round | Steady CPL; urgency drives 12–16% conversion rates |
For HVAC, shoulder seasons often give you a better shot at lower CPLs. That's a smart time to run maintenance offers, before homeowners hit panic mode and before competition heats up. Then, during peak season, use higher CPL targets to protect margin and lean on off-season pricing when you want more lead volume.
CPL is only part of the story. What matters more is cost per booked job.
A $200 lead for a $10,000 roofing project is not the same as a $50 lead for a $150 plumbing repair. On paper, the cheaper lead looks better. In practice, the more expensive lead may leave you with far more money in the bank.
Lead type matters too. Exclusive leads - the kind generated right inside Facebook's native lead forms - close at 25–50%, compared to just 5–20% for shared leads. That's a huge gap. You're not just paying for a name and phone number. You're paying for a shot at a job that may close at a much higher rate.
Plumbing shows this clearly. Emergency-intent plumbing leads convert at 12–16% because people need help now, not next week after comparing five quotes. In that kind of situation, paying more per lead can make perfect sense if your team follows up fast.
Use CPL as a planning input, not the final score. Start with your target cost per booked job, then work backward into budget. These benchmark ranges are the starting point for your 2026 budget formula.
Use those CPL ranges to set a monthly budget that fits each trade. The simplest way to do it is to work backward from jobs, not ads.
Start with the number of jobs your crew can take on in a month. Then divide that by your close rate to find the number of leads you need. After that, multiply by the benchmark CPL for that trade to get your base spend. Add a 15%–20% testing buffer so the algorithm has room to find better-fit homeowners while you test new creative and audience setups.
For example, an HVAC contractor with a $4,500 average job value, a 35% profit margin, and a 20% close rate can support a max CPL of about $105.
| Trade | Target Leads/Mo. | Benchmark CPL | Base Budget | Testing Buffer (20%) | Total Monthly Budget |
|---|---|---|---|---|---|
| HVAC | 30 | $104 | $3,120 | $624 | $3,744 |
| Plumbing | 40 | $73 | $2,920 | $584 | $3,504 |
| Roofing | 15 | $228 | $3,420 | $684 | $4,104 |
| Landscaping | 50 | $85 | $4,250 | $850 | $5,100 |
| Electrical | 35 | $94 | $3,290 | $658 | $3,948 |
One flat budget across every service line usually leads to bad decisions. A $150 hardscaping lead might still make sense. A $150 lawn maintenance lead usually does not. That’s why it helps to split budgets by service type and run the formula for each one on its own.
Once you’ve set the budget, the next step is simple: let performance tell you whether to push spend higher, keep it steady, or pull back.
Benchmarks only help if you use them to make live budget calls. Before you change spend, compare your actual numbers against the benchmark ranges.
If your CPL is still in range but your booking rate is weak, the issue probably isn’t budget. It’s follow-up. The average contractor callback time is over 14 hours, and that delay alone can waste a campaign that looks fine on paper.
Here’s the practical way to think about it:
If your click-through rate is below 0.9% for a trade like fencing, the problem is more likely your ad creative or your offer than the budget itself.
Knowing the benchmarks is one thing. Using them inside a live campaign is where the hard part starts.
Estatehub helps contractors turn benchmark data into ad spend decisions through paid ads and CRM tools built to support faster follow-up. Instead of chasing lead volume by itself, Estatehub shapes campaigns around the math of each service line. That means putting more weight on high-value jobs and less on low-margin clicks that look busy but don’t pay off.
Its CRM tools can also help cut speed-to-lead time, which is one of the biggest reasons a benchmark-level CPL still fails to turn into revenue.
Those budget decisions should be checked against the benchmark method below.
Use the ranges above for planning, not as fixed targets.
These benchmarks pull from 2024–2026 Meta ad data, U.S. home service cost guides, and lead-generation studies. They were then checked against Estatehub's $8,000,000 in ad spend and $14.9 million across 800+ contractor accounts.
Every figure here is shown as a range, not a promise. Actual CPLs change based on your service area, offer quality, local competition, seasonal demand, and how fast your team follows up.
These numbers reflect Facebook lead-form campaigns. They do not reflect traffic campaigns or boosted posts.
Turn these benchmarks into budget choices, then judge results by booked jobs, not leads by themselves.
Once the source data is clear, the planning rules get pretty simple. Build budgets from lead targets and close rates, not random spend goals. CPLs in home services are high enough that your budget needs to connect back to job value, close rate, and follow-up quality.
A few numbers matter most:
Think of these benchmarks as a planning tool. They show what normal performance looks like, where your numbers should land, and when something feels off. The main levers are speed to lead, offer quality, and cost per booked job.
Your Facebook budget is probably too low if Meta isn’t getting enough data to learn what’s working. As a rule of thumb, $200 to $300 per month usually won’t give the system enough room to find the right audience.
A tighter test of $35 to $50 per day for five to seven days is the minimum if you want signals you can actually use. If money’s tight, fix the basics first, like response times or phone scripts, before you spend more.
In 2026, a good CPL for most home-service trades sits around $30 to $150. But that number only means so much on its own. The better way to judge CPL is by trade and channel.
For Meta/Facebook lead generation, well-optimized campaigns often come in around $20 to $45 per lead, with a home-services benchmark near $34.
By trade, the usual ranges look like this:
Put more budget into the seasons when demand heats up and competition gets tougher. Then ease back when costs drop.
For example, landscaping CPL is often lowest in winter at $20–$50 and highest in spring and summer at $75–$175. HVAC usually sees cost spikes in summer and winter.
Start increasing spend before peak demand hits. Then, during slower stretches, lean on lower-cost retention channels like email and SMS instead of paid prospecting.
Track CPL every week, and only scale when the math still works at the booked-job level.
Sign up for the newsletter and be the first to read our articles.


Every single person on our agency team has spent a lot of time in the field either running their own business or working for larger marketing agencies. We have all put in the time responding to leads, helping customers, scheduling and doing services. This gives us a massive advantage when making decisions.
One thing that has always been very special to us, is the fact that (excluding spam / people that never used our services) we do not have any bad reviews. This absolutely does not mean we have never had unhappy clients, but if it happens, we make it right, and stand behind our promises.
We have seen, time and time again, other agencies using strategies and structuring campaigns the way that they are technically supposed to. Most of these "best practices" that are taught in our industry, simply do not transfer into local lead gen. This is partially because we do have a much different target audience, and are typically spending less, however optimizing for website traffic does not work here.
We have been there, jumping into starting a home service business, struggling, and doing everything wrong. It's humbling. Our team has all felt the highs and lows, which is why we get so excited for our clients to win, we know how good it feels.

Estatehub is not a normal agency, we know "clicks" don't get you sales. Let us show you how lead gen experts do it.

