

Overview of Common Stains
Full overview of the most common stains, including how to identify them and treat them
Good SEO reporting cuts confusion and helps both sides make decisions from the same data. If I set up reporting the right way, I can cut manual reporting time from 5 to 10 hours per client each month down to a much smaller workload, while giving clients a live view of calls, form leads, booked jobs, and revenue.
Here’s the short version:
This matters most for home service companies. A roofer, fence installer, or pressure washing company does not care much about crawl errors by themselves. They care about whether organic search turned into phone calls, quote requests, and booked work.
My takeaway is simple: SEO reporting works best when it stops being a monthly data dump and becomes a shared system for decisions, accountability, and client trust.
If I were building this process, I’d keep the dashboard simple, connect each metric to a clear goal, and use every report to move the next action forward.
Before you build a report, sit down with your client and agree on what success looks like for their business. A roofing company and a pressure washing crew might both want more jobs, but their service areas and busy seasons aren't the same. That changes what matters.
From there, trim the report down to the few metrics that show progress.
Use 5–7 core KPIs tied to business outcomes. Once you go past 8 metrics, people tend to pay less attention and decisions get harder.
For contractors and home service providers, the numbers that matter most connect to actual business activity: tracked calls, form fills, estimate requests, booked appointments, closed jobs, and pipeline value in U.S. dollars. Organic traffic and keyword rankings still matter, but they should support the revenue story, not drive it.
Clients care about leads, revenue, and cost per acquisition - not Domain Authority or crawl errors.
Use CRM-connected reporting so booked jobs remain the clearest sign of performance.
Once you've agreed on the goals, match each one to a specific data source. A goal like "rank for 'gutter cleaning near me'" connects to Google Business Profile activity, Local Map Pack rankings, and GBP-initiated calls. A goal like "increase estimate requests from the website" connects to organic traffic on service pages, landing page conversion rates, and form fill events in GA4.
After the KPIs are set, tie each one to the source the client already trusts.
| Goal | Key Metrics | Data Source |
|---|---|---|
| More phone calls | Tracked calls, GBP call clicks | CRM / Call Tracking / GBP |
| More estimate requests | Form fills, landing page conversion rate | GA4 |
| Stronger local map visibility | Map Pack rankings, GBP views | BrightLocal / GBP |
| Revenue progress | Booked appointments, closed jobs, pipeline value | CRM |
Mapping each goal to a source keeps the report honest and makes it easier to spot where the funnel leaks.
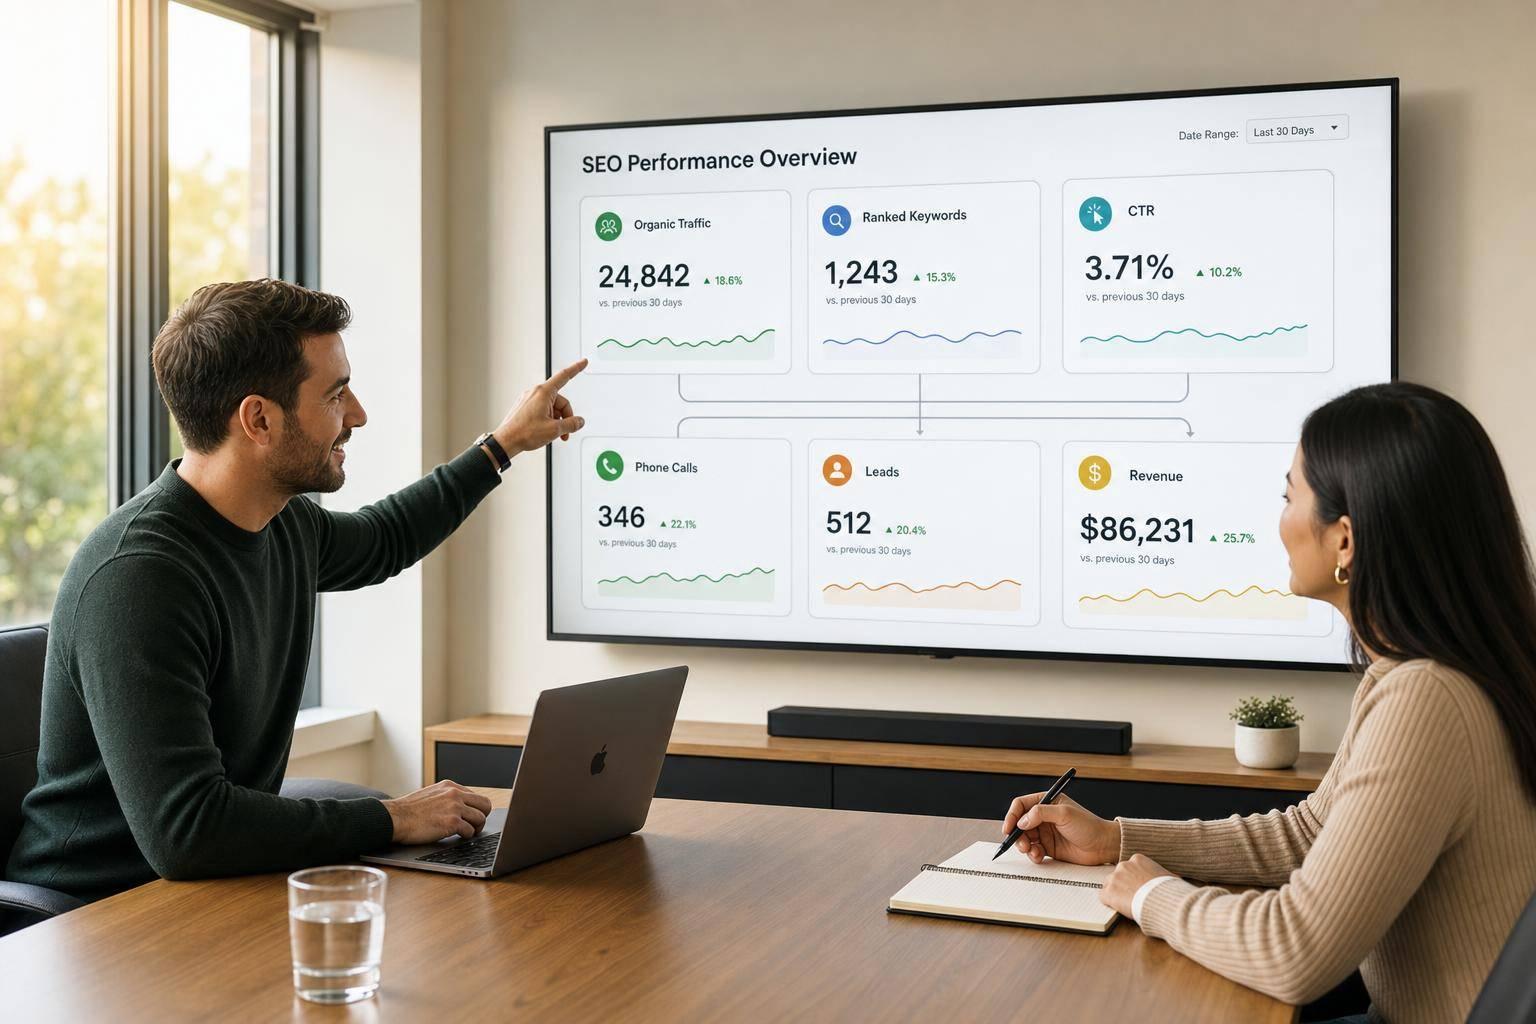
Once your KPIs and data sources are locked in, bring them together in one live dashboard and one repeatable report. The dashboard gives day-to-day visibility. The report explains what the numbers mean and what to do next.
Clients move faster when they can see business growth at a glance. They don't want a wall of marketing terms. They want to know if calls are up, if leads are coming in, and if the work is paying off.
Build the dashboard around the customer path: Visibility → Traffic → Leads → Jobs. Pull your main data from GA4, Google Search Console, Google Business Profile, and your rank tracker. Keep the view tight with 5–7 key metrics so someone can answer "Is this working?" in less than two minutes, without getting lost in chart clutter.
Use plain language everywhere. For example, "GBP Conversions" should become "Phone Calls from Google Maps." Instead of showing a raw acronym, spell out what happened in simple terms, like "How many people saw you vs. clicked." For home service clients, put Map Pack visibility, Google Business Profile calls, and form submissions near the top. Those are the numbers clients use to judge revenue impact.
Add short notes right on the dashboard to explain sharp changes. A line like "Traffic increase due to new HVAC seasonal maintenance blog post," gives context right away, so clients don't have to guess.
A repeatable report format makes life easier for both sides. Start each report with a 3-sentence executive summary: what changed, why it changed, and what happens next. After that, move through headline metrics, wins, issues and fixes, next steps, and an ROI snapshot. That format works for both monthly and biweekly reviews.
Automate the data pulls with direct API connections to GA4, Google Search Console, and your rank tracker. Then write the insight layer by hand. That's where your judgment matters. Moving from manual reporting to automated, tool-based workflows cuts reporting time per client from hours to minutes. It also keeps attention on shared understanding instead of piecing data together.
Use the report summary to shape the client meeting agenda.
A recap by itself doesn't do much. The point is to use the data to answer three simple questions: what changed, why it changed, and what to do next. That shift matters. Instead of turning the meeting into a one-way dump of numbers, it becomes a working session.
Use the shared report as the agenda for the monthly meeting. Start with business outcomes: calls, lead form completions, booked jobs, and revenue. For a home service client, those numbers show whether the campaign is doing its job.
Then move to local visibility: Google Business Profile actions, Map Pack rankings, and direction requests. This part helps show where momentum is building and which service areas still need work.
After that, look at recent SEO work and the result it drove. Maybe a seasonal service page helped traffic. Maybe a new article moved rankings for a high-intent keyword. Maybe a technical fix cleared crawl errors. Tie the work to the result so the client can see what happened and why.
Wrap up with next actions and ownership. Who is doing what next? When that is clear, the meeting ends with a plan instead of loose ideas.
Raw numbers without any context can send people in the wrong direction. A sudden drop in organic traffic can look bad at first glance. Then a note on the chart shows it happened at the same time as a Google algorithm update. That small bit of context changes the conversation fast.
Add notes that explain each decision, not just each swing in the data.
Put each decision next to the metric that led to it. If a client chooses to shift budget toward the services that convert best during peak season, write that note in the report. It gives everyone a record to look back on, and it makes the next meeting easier to prep.
Live reporting reduces prep time, keeps data current, and makes decisions easier to record.
Once the meeting flow is set, the next move is making sure the right people have access and that the rollout plan stays simple.
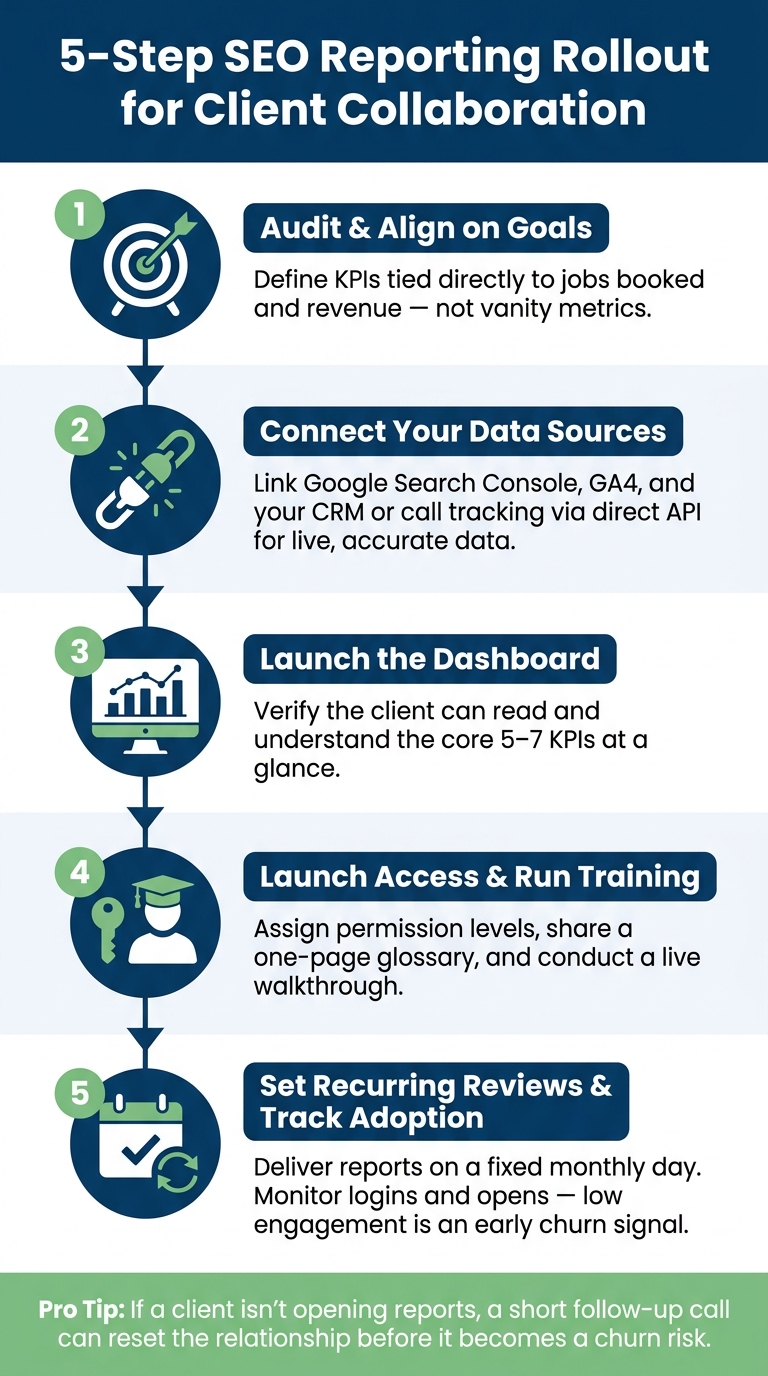
5-Step SEO Reporting Rollout Plan for Client Collaboration
Once the dashboard and meeting flow are in place, give clients controlled access so they can check the same numbers between reviews.
Not every client needs the same view. A plumbing business owner usually wants to see calls, leads, revenue, and which service areas are growing. They usually do not want crawl error logs or backlink audits. That’s why it helps to set up two access layers from day one.
The first is a Client Summary View. This should focus on leads, lead and revenue performance, and local visibility. The second is an Internal Analyst View for your team, covering technical health, keyword movement, and page-level data. Keeping these views separate protects your internal game plan while still giving clients the clarity they need to feel confident.
Trust grows when clients can log in and see the metrics they use to judge performance.
Access alone isn’t enough, though. Pair it with a short onboarding walkthrough. Go through the report from top to bottom: start with business results, then move to local visibility, then cover next steps. It also helps to share a one-page glossary for the terms clients will see in the report.
With access and training set, rollout becomes a simple process:
That last step matters more than many agencies think. If a client isn’t opening reports or using the dashboard, that’s often an early sign they’re starting to drift away. A short follow-up call can help reset the relationship before it turns into a churn risk.
| Role | Responsibility |
|---|---|
| Strategist | Defines high-level KPIs, reviews data for anomalies, writes monthly insight summaries |
| Account Manager | Manages client communication, conducts walkthroughs, and leads monthly or quarterly reviews |
| Analyst | Configures API connections, builds dashboard templates, and monitors technical health |
Choose SEO KPIs by tying them directly to your client’s business goals, like lead generation or revenue growth. The idea is simple: start with the client’s top quarterly goals, then choose five to seven core metrics that show whether SEO is moving things in the right direction.
Keep a steady set of universal KPIs in place, such as organic sessions and keyword rankings. Then add client-specific metrics when they matter. For example, a home services business may need local pack rankings on top of the standard SEO numbers.
An effective SEO dashboard pulls data from the main sources into one place, so clients can see what’s happening without digging through five different tools. It also makes teamwork smoother because everyone is looking at the same numbers.
Include:
Look for clear signs that clients are paying attention. They show up to monthly reviews more prepared, send fewer urgent questions between meetings, and ask sharper follow-up questions about the metrics.
If you use live dashboards instead of static PDFs, there’s another clue: you can see when clients open the report on their own.
Sign up for the newsletter and be the first to read our articles.


Every single person on our agency team has spent a lot of time in the field either running their own business or working for larger marketing agencies. We have all put in the time responding to leads, helping customers, scheduling and doing services. This gives us a massive advantage when making decisions.
One thing that has always been very special to us, is the fact that (excluding spam / people that never used our services) we do not have any bad reviews. This absolutely does not mean we have never had unhappy clients, but if it happens, we make it right, and stand behind our promises.
We have seen, time and time again, other agencies using strategies and structuring campaigns the way that they are technically supposed to. Most of these "best practices" that are taught in our industry, simply do not transfer into local lead gen. This is partially because we do have a much different target audience, and are typically spending less, however optimizing for website traffic does not work here.
We have been there, jumping into starting a home service business, struggling, and doing everything wrong. It's humbling. Our team has all felt the highs and lows, which is why we get so excited for our clients to win, we know how good it feels.

Estatehub is not a normal agency, we know "clicks" don't get you sales. Let us show you how lead gen experts do it.

