

Overview of Common Stains
Full overview of the most common stains, including how to identify them and treat them
If your CRM does not track response time, lead source, booked jobs, and revenue, you cannot tell which leads turn into money.
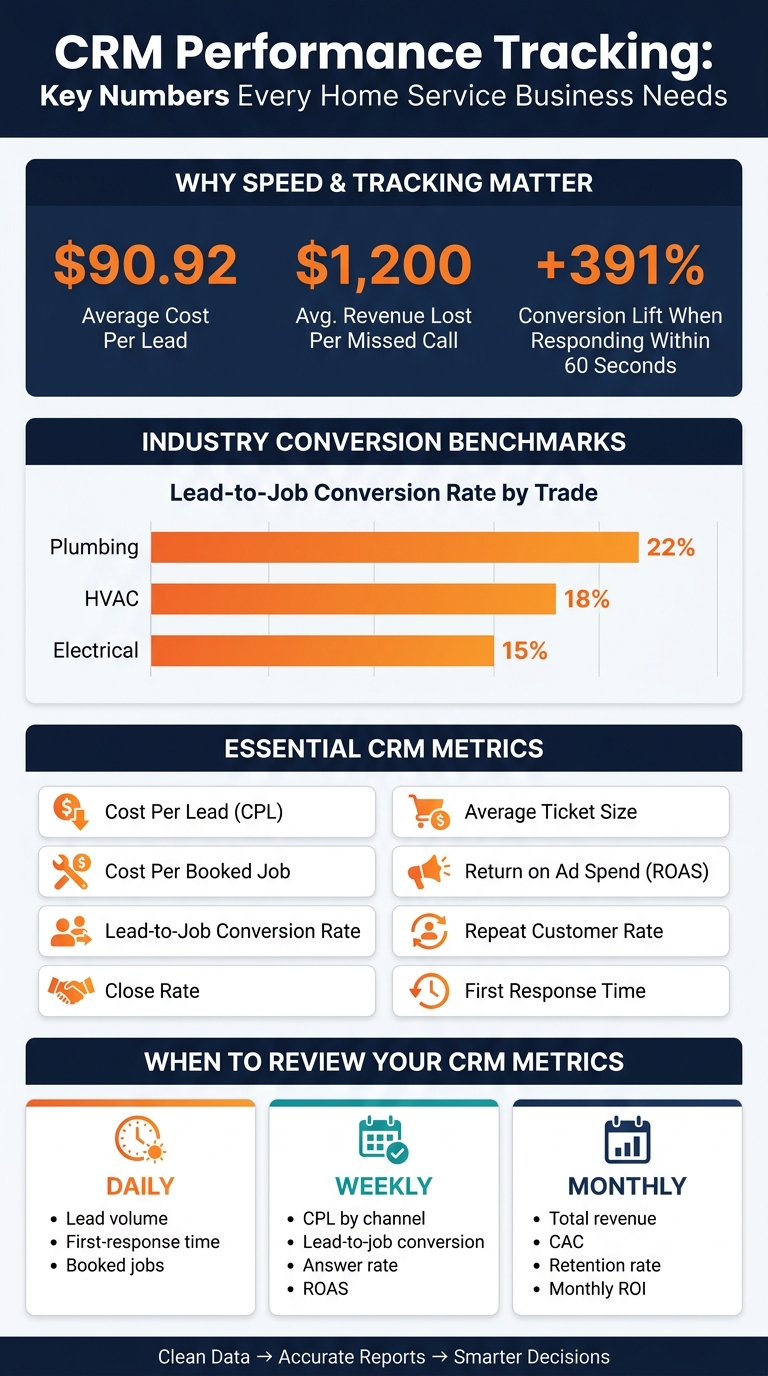
For home service companies, that gap gets expensive fast. The article shows that leads cost $90.92 on average, missed calls can cost about $1,200 each, and replying within 60 seconds can lift conversion rates by up to 391%. The main point is simple: your CRM should not just store contacts. It should show you which leads book, which jobs close, and which marketing channels pay off.
Here’s the short version:
A few benchmark numbers help you judge performance. Lead-to-job conversion rates in the article average 22% for plumbing, 18% for HVAC, and 15% for electrical. That gives you a plain starting point for spotting weak intake, poor follow-up, or low-quality leads.
The article also explains that clean reports depend on clean inputs. If your team skips lead source, quote value, owner name, or close dates, your reports may look neat while the answers are off. That is why the piece puts so much focus on setup before dashboards.
| Area | What to Track | Why It Matters |
|---|---|---|
| Lead intake | Response time, answer rate, lead source | Shows whether leads are being worked fast enough |
| Sales | Conversion rate, close rate, quote follow-up | Shows whether interest turns into booked work |
| Revenue | Ticket size, ROAS, cost per booked job | Shows whether marketing and sales produce cash |
| Retention | Repeat rate, LTV | Shows whether customers come back and spend more |
| Data setup | Required fields, pipeline stages, automations | Keeps reports accurate |
If you want your CRM to help drive growth instead of just hold records, this article lays out the numbers, setup steps, dashboards, and review rhythm you need.
CRM KPIs for Home Service Businesses: Key Benchmarks & Metrics
Track the metrics that connect straight to booked jobs, revenue, and repeat business.
Start with lead flow. You need to know how people enter the CRM and what happens next.
Lead volume shows how many new contacts entered your CRM during a set period. It gives you a plain count of top-of-funnel activity.
Cost Per Lead (CPL), calculated as Total Spend ÷ Total Leads, shows what you paid to bring those leads in. That matters. But CPL alone doesn't tell you if those leads turn into money.
That’s where Cost Per Booked Job helps. Use it when you want the cost of actual revenue, not just the cost of names in the system: Total Marketing Spend ÷ Actual Jobs Booked.
Then look at lead-to-job conversion rate: (Booked Jobs ÷ Total Leads × 100). This tells you how well your team turns interest into booked work. It’s one of the clearest signals of intake performance. Benchmarks help put your number in context: plumbing averages 22%, HVAC 18%, and electrical 15%.
Once leads are in, the next step is simple: see how well the pipeline turns them into sales, cash, and repeat work.
Close rate, calculated as (Sold Jobs ÷ Total Estimates × 100), shows how well technicians or sales staff turn on-site visits into signed jobs.
Average ticket size - Total Revenue ÷ Number of Jobs - helps you see whether you’re landing the right work or just filling the calendar with lower-value calls.
Revenue is the top-line number, but it doesn’t tell the whole story by itself. Cycle time shows how fast leads turn into cash. Track it next to revenue so you can spot slowdowns in the pipeline, not just dips in output.
For long-term business health, watch repeat customer rate and customer lifetime value (LTV). Repeat customer rate is (Returning Customers ÷ Total Unique Customers × 100). It shows whether people come back. LTV shows what a customer is worth over time, which matters a lot if you offer maintenance plans or recurring service agreements. Those customers can push LTV up in a big way.
The LTV:CAC ratio compares lifetime value to customer acquisition cost. Review it on a trailing 12-month basis so seasonality doesn’t skew the picture.
Last, track speed and customer sentiment. These shape rebooking, reviews, and referral momentum.
First response time is the gap between when a lead enters the CRM and when someone contacts them. That gap matters because speed to lead is a primary driver of conversion.
Customer satisfaction, along with review signals recorded in the CRM, helps show how the service experience felt on the customer side. Numbers like booked jobs and revenue matter, but so does how people talk about the business after the work is done.
The table below brings the key KPIs into one place:
| Metric Name | Formula | Primary CRM Data Source | Review Frequency |
|---|---|---|---|
| Cost Per Lead (CPL) | Total Spend ÷ Total Leads | Marketing spend + CRM lead entry | Monthly |
| Cost Per Booked Job | Total Spend ÷ Actual Jobs Booked | Marketing spend + CRM job status | Monthly |
| Lead-to-Job Conversion | (Booked Jobs ÷ Total Leads) × 100 | CRM lead & job modules | Weekly |
| Close Rate | (Sold Jobs ÷ Total Estimates) × 100 | CRM estimates & invoices | Weekly |
| Average Ticket Size | Total Revenue ÷ Number of Jobs | CRM closed invoices | Monthly |
| Return on Ad Spend (ROAS) | Revenue from Ads ÷ Ad Spend | CRM revenue attribution + ad platform | Monthly |
| LTV:CAC Ratio | Customer Lifetime Value ÷ Acquisition Cost | CRM customer history | Trailing 12 months |
| First Response Time | Time from lead creation to first contact | CRM communication logs | Weekly |
| Repeat Customer Rate | (Returning Customers ÷ Total Unique Customers) × 100 | CRM customer history | Quarterly |
These KPIs only mean something if every lead, job, and invoice is logged the same way. If the CRM data is messy, the math looks clean while the answer is wrong.
KPIs are only as good as the data behind them.
If lead source, job value, and contact records are incomplete or full of duplicates, every report starts to drift. And when that happens, lead counts get inflated, attribution breaks, and close rates stop telling the truth.
About 80% of companies report major data quality problems in their CRM, including duplicates and missing fields. In a home service business, that pain shows up fast. One bad record here and one missing field there can throw off the whole picture.
Set five required fields for every new lead and job:
If people can save a record without filling these out, they usually will. Missing source, value, and owner data skews lead-to-job conversion and cost-per-booked-job reporting.
Service naming is another common mess. If one tech enters "AC tuneup" and another uses "HVAC check", your reports treat one job type like two separate categories. The fix is simple: use a standardized dropdown for service type so everyone logs the same thing.
A quarterly audit helps catch the stuff that slips through. Check for deals stuck in "Quote Sent" too long, closed jobs with no close date, and contacts that share the same phone number or email. Then clean it up. Merge duplicates, update stale stages with a loss reason, and fill in missing dates from call logs or email history when you can.
Once your fields are locked down, line them up with stages that match how jobs move in the real world.
A six-stage pipeline works for most small to mid-sized home service contractors:
New Lead → Contacted → Appointment Set → Quote Sent → Closed Won → Closed Lost
Here’s what each stage should mean:
This setup makes lead-to-job conversion, cycle time, and close rate easy to measure without guesswork. It also connects quotes and closed jobs to an owner, so estimator performance is easy to see.
Automation helps keep records current as jobs move through the pipeline.
Manual entry leaves holes. Callbacks get forgotten. Missed calls never make it into the system. Deals sit in the wrong stage for days. A few simple automations can clean that up:
| Factor | Manual Entry | Automated Capture |
|---|---|---|
| Data Quality | Inconsistent; gaps in key fields | Consistent; fields populated by triggers |
| Report Reliability | Low to moderate; gaps distort KPIs | High; key fields captured at the right moment |
| Workload | High; staff must log every action | Low; system handles routine capture |
With clean data and tighter workflows, dashboards and reports become a lot more useful.
Clean data and tight workflows set the foundation. The next step is simple: turn that data into dashboards your owner, office staff, and field managers can read fast and act on fast.
Each dashboard should answer a different business question. One should show where revenue comes from. Another should show where leads are getting stuck. A third should show where field work is slowing down.
Most home service businesses only need three dashboards: one for the owner, one for the office, and one for operations.
The Owner Dashboard gives a quick read on business health. It should track total revenue vs. forecast, pipeline value, cost per booked job, and marketing ROI. These numbers usually make the most sense on a monthly or quarterly view.
The Sales/Office Dashboard lives at the front end of the business. It should show lead response time, follow-up rate, and lead-to-job conversion rate. These metrics should update daily or weekly so the office team can step in before leads go cold.
The Operations Dashboard focuses on field performance. Track jobs completed per technician, dispatch response time, and customer satisfaction scores. Weekly updates help service managers spot dispatch slowdowns before they turn into a bigger mess.
Keep each dashboard tight. Five to seven metrics per view is usually enough, as long as each one ties to a clear decision.
A report only helps if people trust it. And that trust comes from a steady structure, not just clean data.
Use the same date format across every report: MM/DD/YYYY. Keep time periods consistent too, like This Month, This Week (Monday–Sunday), and year-over-year (YoY) views. Month-over-month (MoM) changes help you catch short-term movement. YoY comparisons help account for seasonality, which matters a lot in home services. It also helps to check report totals against raw CRM records from time to time so the team knows the numbers hold up.
Put the most important KPIs in the top-left of each dashboard. That’s where people look first. Add color-coded indicators like green for on-target and red for below target, so someone can scan the page in under 30 seconds and know what needs attention.
Once the right dashboards are in place, standardize report formats so the numbers stay easy to trust.
The table below maps each dashboard to its main KPIs, update frequency, and the CRM fields behind it.
| Dashboard Type | Primary KPIs | Update Frequency | Key CRM Fields Used |
|---|---|---|---|
| Owner | Revenue, pipeline value, marketing ROI, cost per booked job | Monthly / Quarterly | Lead source, deal value, close date, marketing spend |
| Sales / Office | Lead response time, follow-up rate, lead conversion rate | Daily / Weekly | Lead created date, first contact date, lead status, call logs |
| Operations | Jobs per technician, dispatch response time, CSAT / NPS | Weekly | Assigned technician, job completion date, survey score |
Estatehub ties leads, booked appointments, and closed revenue back to the original source, so owners can see which campaigns drive profitable jobs.
Dashboards are only useful if you review them on a set schedule and do something with what you find. That’s where the owner, office, and operations dashboards from the previous section come in. They give each review a clear focus instead of turning it into a vague check-in.
Daily reviews should stay tight. Look at new leads, first-response time, and booked jobs. These numbers move fast, and small misses can get expensive fast too. A missed call costs an average of $1,200 in lost revenue, and 27% of calls to home service businesses go unanswered. If first-response time slips on Tuesday morning, you want to know then, not at the end of the week.
Weekly reviews are where you spot wasted ad spend and conversion issues before they snowball. Pay close attention to cost per lead (CPL) by channel, lead-to-job conversion rate, answer rate, and return on ad spend (ROAS). If CPL jumps, tighten ad targeting or refresh the ad creative before the monthly budget runs dry. If lead-to-job conversion falls, listen to call recordings, coach the team on intake and follow-up speed, and see whether one channel is sending low-intent leads.
Monthly reviews should zoom out. Pull total revenue, customer acquisition cost (CAC), retention and referral rates, and monthly ROI. Then compare those numbers against the prior month. Seasonality matters here because it changes both lead volume and lead quality.
Once you have that rhythm in place, trend changes tell you where to look next.
A metric change does not always mean something is broken. But it does mean something changed. Before reacting, compare the current number to a prior period. One rough week might just be noise. Two straight weeks of decline usually means you’re looking at a pattern.
Use the table below to turn metric changes into next steps.
| Metric | What a Change Likely Means | Recommended Action |
|---|---|---|
| First-Response Time Increases | Automation failed or team is overloaded | Add 60-second automated text and email triggers |
| Lead-to-Job Conversion Drops | Follow-up is too slow or intake scripts are weak | Review call recordings; coach staff on intake and follow-up speed |
| CPL Rises | Targeting widened or competition increased | Tighten targeting or refresh ad creative |
| ROAS Declines | Ad spend is high, but jobs booked are low-value or infrequent | Pause underperforming campaigns; shift budget to high-value job types |
| No-Show Rate Rises | Customers aren't being re-engaged after booking | Automate text and email reminders through your CRM |
Start with your main business goals. Instead of tracking every metric you can find, focus on 5 to 9 KPIs that directly support goals like revenue growth, lead generation, or customer retention.
Pick metrics that tie back to a clear goal, lead to action, and are easy to track with confidence. It also helps to get the basics right first: adoption and data quality. Once those are in place, you can layer in more advanced performance metrics.
Keep lead forms simple. Ask only for the basics: name, email, phone number, and address.
Then add the details your team needs for tracking and follow-up. That includes lead source, service type, preferred start date, pain points, and attribution data like UTM parameters, GCLID, and call details such as call duration and caller ID.
Use a tiered review schedule:
Estatehub can help streamline this analysis and support steady, data-driven growth.
Sign up for the newsletter and be the first to read our articles.


Every single person on our agency team has spent a lot of time in the field either running their own business or working for larger marketing agencies. We have all put in the time responding to leads, helping customers, scheduling and doing services. This gives us a massive advantage when making decisions.
One thing that has always been very special to us, is the fact that (excluding spam / people that never used our services) we do not have any bad reviews. This absolutely does not mean we have never had unhappy clients, but if it happens, we make it right, and stand behind our promises.
We have seen, time and time again, other agencies using strategies and structuring campaigns the way that they are technically supposed to. Most of these "best practices" that are taught in our industry, simply do not transfer into local lead gen. This is partially because we do have a much different target audience, and are typically spending less, however optimizing for website traffic does not work here.
We have been there, jumping into starting a home service business, struggling, and doing everything wrong. It's humbling. Our team has all felt the highs and lows, which is why we get so excited for our clients to win, we know how good it feels.

Estatehub is not a normal agency, we know "clicks" don't get you sales. Let us show you how lead gen experts do it.

